The general purpose, automated KPI anomaly detection tool.
This is the multi-page printable view of this section. Click here to print.
Horreum Docs
- 1: Overview
- 2: Tutorials
- 2.1: Get Started
- 2.2: Upload your first Run
- 2.3: Query Collector API
- 2.4: Use data in Grafana
- 2.5: Query Elasticsearch
- 3: Concepts
- 3.1: Core Concepts
- 3.2: Horreum Terminology
- 3.3: Users and security
- 4: Change Detection
- 5: Core Tasks
- 5.1: API Keys
- 5.2: Add Users and Set Roles
- 5.3: Create new test
- 5.4: Import and Export Tests and Schemas
- 5.5: Manage Reports
- 5.6: Upload Run
- 5.7: Define Functions
- 5.8: Dataset Experiment Evaluation
- 5.9: Transform Runs to Datasets
- 5.10: Configure Change Detection
- 5.11: Configure Actions
- 5.12: Re-transform a Run
- 5.13: Define a Schema
- 6: Integrations
- 6.1: Collector API
- 6.2: Slack
- 6.3: ElasticSearch
- 6.4: Jenkins
- 6.5: Postgres
- 6.6: Grafana
- 7: Deployment
- 7.1: Bare-metal
- 7.2: OpenShift/Kubernetes
- 8: Reference
- 8.1: Horreum Clients
- 8.2: Webhook Reference
- 8.3: API Filter Queries
- 8.4: Troubleshooting Functions
1 - Overview
What is Horreum? How can it help you?
What is Horreum?
Horreum is a general purpose performance metric change detection system.
Horreum integrates into software build pipelines to provide automated analysis of key performance indicators of software performance.
Horreum will detect regressions and alert engineers when a performance anomoly occurs.
Horreum integrates into reporting tools to provide detailed analysis of key metrics of your software performance
Want to know more?
Give your users next steps from the Overview. For example:
- Getting Started: Get started with $project
2 - Tutorials
Step-by-step guides to get you started with Horreum
2.1 - Get Started
Start Horreum on your local machine in 3 easy steps
Running Horreum locally
In this tutorial we’ll show you how to start Horreum and its infrastructure using container technologies such as podman or docker.
1: install required software
Make sure that you have either podman and podman-compose or docker and docker-compose installed. Some scripting we have prepared to simplify the startup also requires curl and jq. On Fedora you would run
sudo dnf install -y curl jq podman podman-plugins podman-compose
This setup is going to use ports 8080 (Horreum application), 8180 (Keycloak), and 5432 (PostgreSQL) on localhost. Please make sure that these are not used by any other application.
2: start Horreum
We have prepared a simple script that downloads all the necessary files and starts all containers in host-network mode:
curl -s https://raw.githubusercontent.com/Hyperfoil/Horreum/0.6/infra/start.sh | bash
After a few moments everything should be up and ready, and a browser pointed to http://localhost:8080 will open.
3: log in
In the upper right corner you should see the Log in button. Press that and fill in username user and password secret. When you sign in the upper right corner you should see that you’re authenticated as ‘Dummy User’.

User logged in
You can explore the application but at this moment it is empty. Let’s continue with creating a test and uploading a run.
stop Horreum
You can stop and remove all the containers using the command below:
podman kill $(podman ps -q --filter 'label=io.podman.compose.project=horreum')
podman rm $(podman ps -q -a --filter 'label=io.podman.compose.project=horreum')
2.2 - Upload your first Run
Upload your first run to Horreum
Create a Test and upload a Run
This tutorial will present the most basic thing Horreum can do: store your benchmark results in the form of JSON files.
We assume that you already went through the previous tutorial, Horreum is up and you are logged in.

User logged in
1. Create Test
Press the New Test button and fill the test name. Test names must be unique within Horreum.
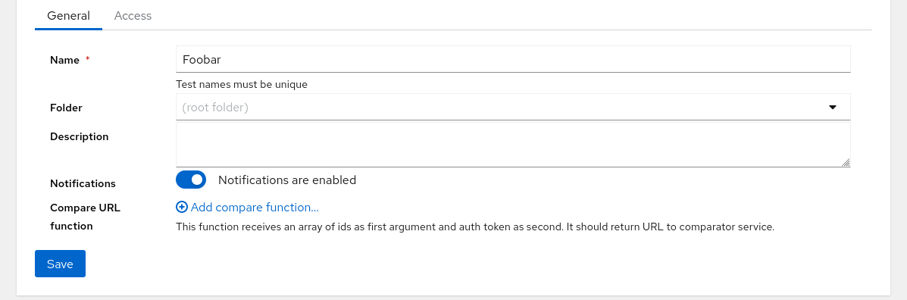
Create new test
Click on Save button on left side at the bottom - a blue banner will confirm that the test was created.
2. Prepare test data
Now we can prepare the JSON document representing our benchmark results - open /tmp/run.json with your favorite text editor and paste in this:
{
  "$schema": "urn:my-schema:1.0",
  "throughput": 1234.5
}
3. Generate API Key
To interact with the REST API, you will need an API Key, please follow the instructions to generate an API Key
4. Upload Data
Now copy and paste this into shell; the reply will be just 1 - the ID of the newly uploaded run.
API_KEY='HUSR_00000000_0000_0000_0000_000000000000'
TEST='Foobar'
START='2021-08-01T10:35:22.00Z'
STOP='2021-08-01T10:40:28.00Z'
OWNER='dev-team'
ACCESS='PUBLIC'
curl 'http://localhost:8080/api/run/data?test='$TEST'&start='$START'&stop='$STOP'&owner='$OWNER'&access='$ACCESS \
    -s -H 'content-type: application/json' -H "X-Horreum-API-Key: $API_KEY" \
    -d @/tmp/run.json
5. View Data in Horreum
Let’s navigate into the tests overview (main page) by clicking the Tests link in the main menu on the top left of the page:

List of Tests
Click on the run count number with open-folder icon to see the listing of all runs for given test:

List of Runs
At this point don’t worry about the ‘No schema’ warning. Hit the run ID with arrow icon in one of the first columns and see the contents of the run you just created:
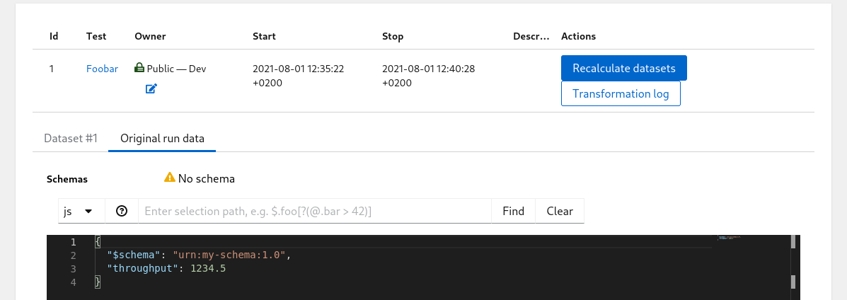
List of Runs
2.3 - Query Collector API
Query JSON data from Collector and analyze it with Horreum
Prerequisites:
- Horreum is running, and you are logged in
- You have access to a running Collector instance that already contains JSON data
- You have previously defined a
Schemafor the JSON data you wish to analyze, please see Define a Schema
Create a Test and query data from a Collector instance
This tutorial will guide you through how to connect to a remote Collector instance, and perform change detection on existing data in an index.
Configure Collector Datastore
Please follow the Collector Integration guide to configure a new Collector Datastore.
Query Data from Collector
The procedure is the same as described in the Upload your first Run tutorial
To query data from a Collector instance, you need to know the tag and imgName of the data you wish to analyze.
You will also need to determine the date range of the data you wish to analyze using newerThan and olderThan.
{
  "tag": "quarkus-main-ci",
  "imgName": "quarkus-integration-test-main-999-SNAPSHOT-runner",
  "newerThan": "2024-09-20 00:00:00.000",
  "olderThan": "2024-09-25 00:00:00.000"
}
where;
- tag: the tag of the data you wish to analyze
- imgName: the image name (aka test) of the data you wish to analyze
- newerThan: the start date of the data you wish to analyze
- olderThan: the end date of the data you wish to analyze
The query can be executed by making a call to the Horreum API;
$ curl 'http://localhost:8080/api/run/data?test='$TEST'&start='$START'&stop='$STOP'&owner='$OWNER'&access='$ACCESS \
    -s -H 'content-type: application/json'  -H "X-Horreum-API-Key: $API_KEY" \
    -d @/tmp/collector_query.json
The query will return a list of RunID’s for each json object retrieved and analyzed from Collector.
What Next?
After successfully querying data from Collector, you can now:
- optionally Transform Runs to Datasets to transform the data into datasets
- Configure Change Detection to detect regressions in the data.
- Configure Actions to trigger events when regressions are detected.
2.4 - Use data in Grafana
use Horreum to create charts in Grafana
Prerequisites:
- Horreum is running, and you have an access token
- Grafana is running, and you can update dashboards
Grafana setup
This tutorial uses the JSON API plugin to retrieve data from Horreum. The JSON API Plugin can be installed from the grafana administrator panel.
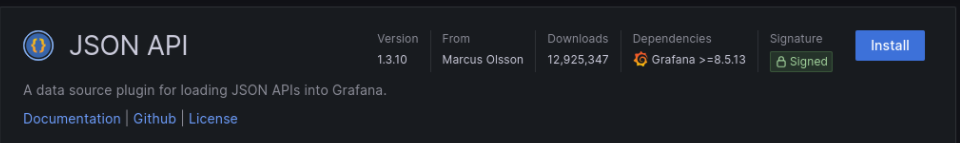
Install JSON API Grafana Plugin
Next we need to create a datasource that will connect to the Horreum URL.
For the example we are connecting to a local development instance of horreum running on localhost using port 8080.
The datasource url does not have to include the /api but including it in the datasource saves us from having to include /api
each time we fetch data from the datasource.
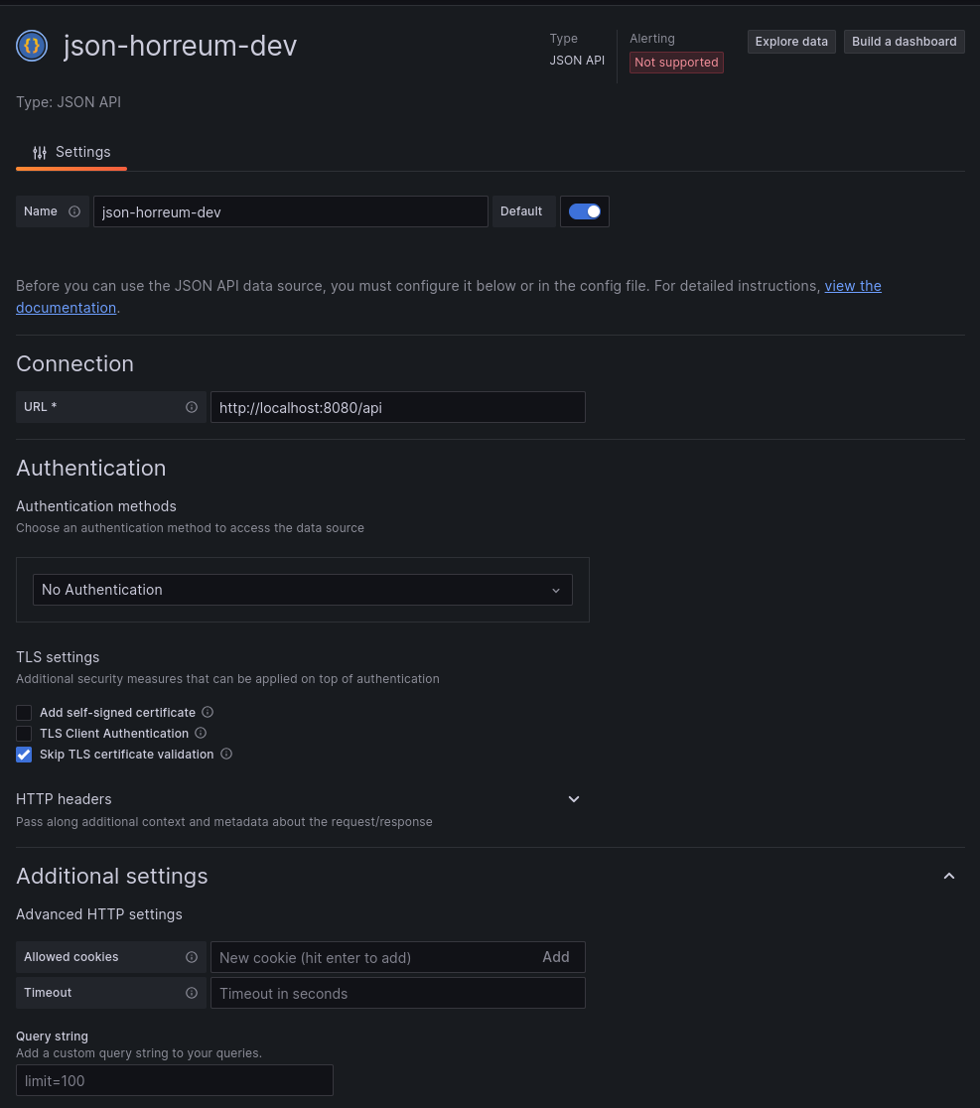
Create JSON API datasource
That’s it, Grafana is ready to start consuming data from Horreum. The next steps depend on what we want to display in Grafana.
Key Metrics in Grafana
Horreum accepts any json format for a run and uses Labels (TODO link) to extract or calculate key metrics.
Metric values, referred to as Label Values in horreum, are automatically calculated for each upload. There is an API
to retrieve the values for a specific upload but that would be tedious for comparing across runs.
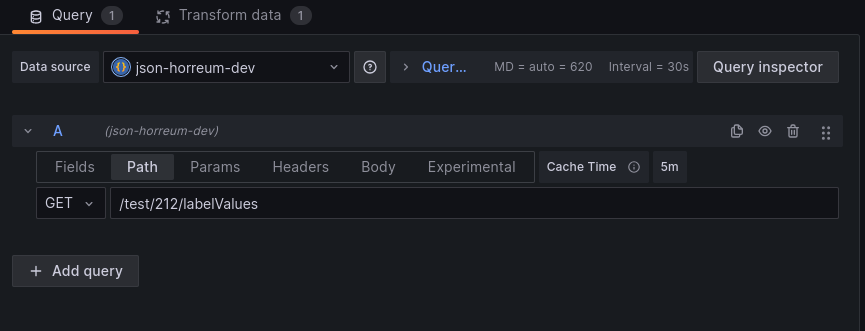
The test api endpoint has a /labelValues (TODO link to documentation) that can retrieve a filtered list of all the label values from each upload.
/test/${testId}/labelValues
The response is a list of json objects that contain the labelValue for each upload. There is actually a json object per dataset but not all runs are parsed into multiple datasets so the distinction is not necessary for most use cases.
[
    {  runId: 101, datasetid: 100, values: {metricName: metricValue,...},
    ...
]
The key data is in the values field of each entry.
Add a panel to a dashboard in grafana then select the new JSON API datasource as the datasource for the panel.
Set panel datasource
Grafana can now access the data but we need to define fields to tell the panel how to extract information from the json.
There are 3 fields for the /labelValues endpoint:
values - the content of the labels
runId - the unique ID assigned to the run that was uploaded to horreum
datasetId - the unique ID that was assigned to the dataset extracted from the run
The example below defines fields in Grafana for all three but the values field is where the metrics are located.
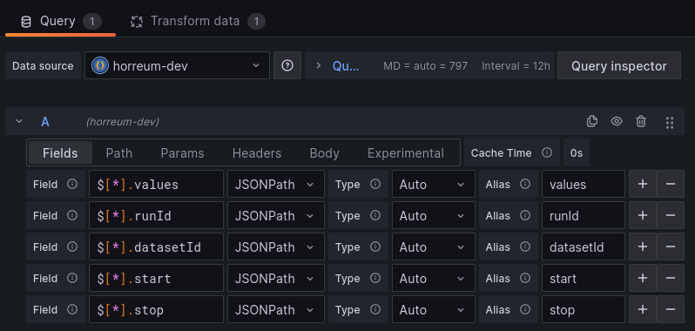
Define fields for the json
The next step is to define a Grafana transform to turn the values into the dataframe structure Grafana expects.
Use the extract fields transform on the values field from the previous step.
Define fields for the json
Grafana should now recognize all the labels as different datapoints. At this point, customizing the grafana panel depends on what values are found in each label and what kind of panel you want to create.
Filtering results
There is a good chance you only want data from certain runs.
The /labelValues endpoint supports a filter query parameter to filter out datasets.
There are 2 ways to filter:
provide a json object that must exist in the label values.
For example, if
versionandtxRateare label names then{"version":"1.2.3"}will only include labelValues whereversion=1.2.3and{"version":"1.2.3","txRate":2000}will add thetxRate=2000requirement.
curl –query-param “filter={"version":"1.2.3","txRate":2000}”
:/api/test/{id}/labelValues
Grafana offers a multi-select option for variables. This sends the options as an array when using json encoding.
Horreum will default to looking for a label with an array value instead of any value in the array.
Adding the multiFilter=true query parameter allows Horreum to also look for any value in the array and supports Grafana mulit-select.
curl –query-param “multiFilter=true” –query-param “filter={"count":[1,2,4,8]}”
:/api/test/{id}/labelValues
provide a json path (an extractor path from labels) that needs to evaluate to true
For example, if
countis a label we can pass in$.count ? (@ > 10 && @ < 20)to only include datasets where count is between 10 and 20.
curl –query-param “filter="$.count ? (@ > 10 && @ < 20)"”
:/api/test/{id}/labelValues
We set the filter parameter by editing the Query for the grafana panel.
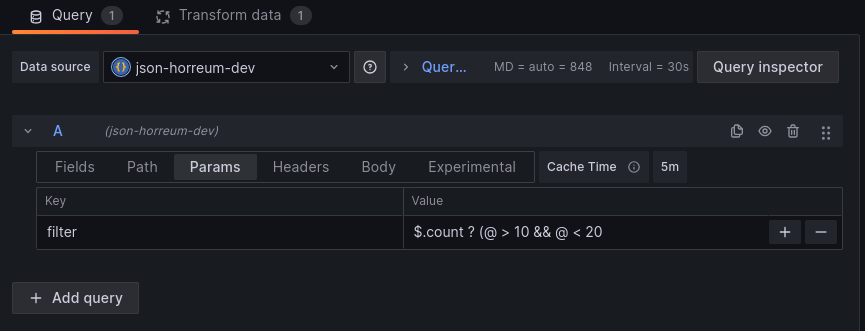
Define filter for query
Filtering labels
Another common consideration is the amount of data in the /labelValues response. Tests with lots of labels, or labels that produce a lot of data,
can see the /labelValues transfer json size grow well beyond what they need for a particular integration. Horreum has the include and exclude
query parameter options on the /labelValues endpoint.
Include
Adding include=foo to the /labelValues endpoint query tells Horreum to only include the foo label and its value in the values part of the
/labelValues response. You can specify multiple labels with incude=foo&include=bar or include=foo,bar using url encoding or with curl:
curl --query-param "include=foo" --query-param "include=bar" ...
Note: any include that is also mentioned in exclude will not be part of the response values
Exclude
This functions similar to include except that it removes a label name from the response values field for the /labelValues endpoint. This filter
option leaves all other labels in the values field.
If a user specifies both include and exclude then the response will only contain the include label names that are not also in exclude. If all
include are also in exclude then the exclude takes priority and the response will contain all labels that are not mentioned in exclude.
Horreum uses this default behavior to avoid sending any data that is explicitly excluded.
2.5 - Query Elasticsearch
Query JSON data from Elasticsearch and analyze it with Horreum
Prerequisites:
- Horreum is running, and you are logged in
- You have access to a running Elasticsearch instance that already contains JSON data
- You have previously defined a
Schemafor the JSON data you wish to analyze, please see Define a Schema
Create a Test and query data from an Elasticsearch instance
This tutorial will guide you through how to connect to a remote Elasticsearch instance, and perform change detection on existing data in an index.
Configure Elasticsearch Datastore
Please follow the Elasticsearch Integration guide to configure a new Elasticsearch Datastore.
Query Data from Elasticsearch
There are two methods for querying existing data from an Elasticsearch instance, either a single document, or multiple documents from a query.
The procedure is the same as described in the Upload your first Run tutorial
Query single document from Elasticsearch datastore
To analyze a single document from Elasticsearch, you need to know the index and document id of the document you wish to analyze.
The json payload for a single Elasticsearch document is as follows:
{
  "index": ".ds-kibana_sample_data_logs-2024.01.11-000001",
  "type": "doc",
  "query": "RUO1-IwBIG0DwQQtm-ea"
}
where;
- index: name of the Elasticsearch index storing the document
- type: “DOC” for a single document
- query: the document id of the document to analyze
The document query can then be sumitted to the Horreum API;
$ curl 'http://localhost:8080/api/run/data?test='$TEST'&start='$START'&stop='$STOP'&owner='$OWNER'&access='$ACCESS \
    -s -H 'content-type: application/json' -H "X-Horreum-API-Key: $API_KEY" \
    -d @/tmp/elastic_payload.json
The api will return the RunID for the document retrieved and analyzed from Elasticsearch.
Query Multiple documents from single index in Elasticsearch datastore
It is also possible to query multiple documents from Elasticsearch with a single call to the Horreum API.
{
    "index": ".ds-kibana_sample_data_logs-2023.12.13-000001",
    "type": "search",
    "query": {
        "from" : 0, "size" : 100,
        "query": {
            "bool" : {
            "must" : [
                { "term" : {  "host": "artifacts.elastic.co" } }
            ],
            "filter": {
                "range": {
                    "utc_time": {
                    "gte": "2023-12-01T09:28:48+00:00",
                    "lte": "2023-12-14T09:28:48+00:00"
                    }
                }
            },
            "boost" : 1.0
            }
        }
    }

}
where;
- index: name of the Elasticsearch index storing the documents
- type: “SEARCH” for a query
- query: the Elasticsearch query to execute
NOTE: The
queryfield can be any query that Elasticsearch search API supports, please see The Search API for more information.
The query can be executed by making a call to the Horreum API;
$ curl 'http://localhost:8080/api/run/data?test='$TEST'&start='$START'&stop='$STOP'&owner='$OWNER'&access='$ACCESS \
    -s -H 'content-type: application/json' -H "X-Horreum-API-Key: $API_KEY" \
    -d @/tmp/elastic_query.json
The query will return a list of RunID’s for each document retrieved and analyzed from Elasticsearch.
Query Multiple Index for documents in Elasticsearch datastore
If your ElasticSearch instance contains meta-data and the associated documents in separate indexes, it is possible to query the meta-data index to retrive a list of documents to analyse with Horreum using a “MULTI_INDEX” query
{
    "index": ".ds-elastic_meta-data-index",
    "type": "multi-index",
    "query": {
      "targetIndex": ".ds-elastic_secondary-index",
      "docField": "remoteDocField",
      "metaQuery": {
        "from": 0,
        "size": 100,
        "query": {
          "bool": {
            "must": [
              {
                "term": {
                  "host": "artifacts.elastic.co"
                }
              }
            ],
            "filter": {
              "range": {
                "utc_time": {
                  "gte": "2023-12-01T09:28:48+00:00",
                  "lte": "2023-12-14T09:28:48+00:00"
                }
              }
            },
            "boost": 1.0
          }
        }
      }
    }
}
where;
- index: name of the Elasticsearch index storing the meta-data
- type: “mult-index” for a multi-index query
- query:
- targetIndex: the name of the index containing the documents to analyze
- docField: the field in the meta-data index that contains the document id of the document to analyze
- metaQuery: the Elasticsearch query to execute on the meta-data index
Horreum will query the meta-data index, retrieve all matching documents. The meta-data and document contents can be used in any Horreum analysis.
The query will return a list of RunID’s for each document retrieved and analyzed from Elasticsearch.
What Next?
After successfully querying data from Elasticsearch, you can now:
- optionally Transform Runs to Datasets to transform the data into datasets
- Configure Change Detection to detect regressions in the data.
- Configure Actions to trigger events when regressions are detected.
3 - Concepts
Horreum concepts
3.1 - Core Concepts
Core Horreum concepts
Teams
A Team is a required top-level organizational and authorization construct.
Folders
A Folder is an optional organizational structure to hold Tests
Schema
A Schema is required by Horreum to define the meta-data associated with a Run
It allows Horreum to process the JSON content to provide validation, charting, and change detection
A Schema defines the following;
- An optional expected structure of a Dataset via a
JSON Validation Schema - Required
Labelsthat define how to use the data in the JSON document - Optional
Transformers, to transform uploaded JSON documents into one or more datasets.
A Schema can apply to an entire Run JSON document, or parts of a Run JSON document
Label
A Label is required to define how metrics are extracted from the JSON document and processed by Horreum.
Labels are defined by one or more required Extractors and an optional Combination Function
There are 2 types of Labels:
Metrics Label: Describes a metric to be used for analysis, e.g. “Max Throughput”, “process RSS”, “startup time” etcFiltering Label: Describes a value that can be used for filteringDatasetsand ensuring that datasets are comparable, e.g. “Cluster Node Count”, “Product version” etc
A Label can be defined as either a Metrics label, a Filtering label, or both.
Filtering Labels are combined into Fingerprints that uniquely identify comparable Datasets within uploaded Runs.
Extractor
An Extractor is a required JSONPath expression that refers to a section of an uploaded JSON document. An Extractor can return one of:
- A scalar value
- An array of values
- A subsection of the uploaded JSON document
Note
In the majority of cases, an Extractor will simply point to a single, scalar valueCombination Function:
A Combination Function is an optional JavaScript function that takes all Extractor values as input and produces a Label value. See Function
Note
In the majority of cases, the Combination Function is simply an Identity function with a single input and does not need to be definedTest
A Test is a required repository for particular similar runs and datasets
You can think of a test as a repo for the results of a particular benchmark, i.e. a benchmark performs a certain set of actions against a system under test
Test Runs can have different configurations, making them not always directly comparable, but the Run results stored under one Test can be filtered by their Fingerprint to ensure that all Datasets used for analysis are comparable
Run
A Run is a particular single upload instance of a Test
A Run is associated with one or more Schemas in order to define what data to expect, and how to process the JSON document
Transformers
A Transformer is optionally defined on a Schema that applies required Extractors and a required Combination Function to transform a Run into one or more Datasets
Transformers are typically used to;
- Restructure the JSON document. This is useful where users are processing JSON documents that they do not have control of the structure, and the structure is not well defined
- Split a
RunJSON output into multiple, non-comparableDatasets. This is useful where a benchmark iterates over a configuration and produces a JSON output that contains multiple results for different configurations
A Schema can have 0, 1 or multiple Transformers defined
Note
In the majority of cases, theRun data does not need to be transformed and there is a one-to-one direct mapping between Run and Dataset. In this instance, an Identity Transformer is used and does not need to be defined by the userDataset
A Dataset is either the entire Run JSON document, or a subset that has been produced by an optional Transformer
It is possible for a Run to include multiple Datasets, and the Transformer(s) defined on a Schema associated with the Run has the job of parsing out the multiple Datasets
Note
In most cases, there is a 1:1 relationship between aRun and a Dataset, when the Dataset is expected to have one unified set of results to be analyzed togetherFingerprint
A Fingerprint is combination of Filtering labels that unique identifies comparable datasets within a test
Function
A Function is a JavaScript function that is executed on the server side. Functions can be used for validating expected data formats, substitution and rendering. Also used in Combination Functions to create derived metrics. See Define Functions for more detailed information.
Datasource
A Datasource is a required top-level organizational construct that defines the source of the data to be stored or retrieved by Horreum. Currently, Horreum supports 3 types of Datasource: Postgres, Elasticsearch, and Collector
Baseline
The initial sample for an Experiment comparison. Configured in an Experiment Profile.
Change Detection Variable
Change detection tracks Schema Labels that have been configured as a Change Detection Variable.
Experiment
This enables running a comparison between Runs for a particular Test. There can be multiple Profiles configured for an Experiment to check for a variety of desired conditions. The outcome status for each Profile condition will be one of the following:
- SAME
- WORSE
- BETTER
Experiment Profile
A Profile consists of:
ExperimentselectorBaseline- 0, 1 or many Comparison conditions
JSON validation schema
An optional schema added to a Test to validate uploaded Run JSON data.
Report Configuration
In Horreum a Report Configuration is used for compiling a summary of information to be displayed using tables.
Report
A Report is an instance of a Report Configuration. Creation date and time is used for differentiating each Report.
Actions
An Action is the ability by Horreum to send an Event notification to an external system. These are added to a Test.
Global Action
Actions that occur globally in Horreum
Test Action
Actions only for a particular Test
Action allow list
Horreum will only allow generic HTTP requests to domains that have been pre-configured in Horreum by an Administrator.
API Filter Query
Horreum API provides query parameters that are JSONPath paths that filter operation results.
3.2 - Horreum Terminology
Horreum Terminology
Any document stored in Horreum is called a Run - usually this is the output of a single CI build. Horreum does not need to know much about: it accepts it as a plain JSON document and stores it in the database with very little metadata.
Each Run belongs to a series called a Test. This is where you can define metrics and setup regression testing.
Sometimes it’s practical to execute a job in CI that produces single JSON document and upload it only once, but in fact it contains results for different configurations or several test cases. It might be more convenient to remix the Run into several documents, and this is where Datasets come. Datasets hold another JSON document that is created from the original Run JSON using Transformers, and share some metadata from the original Run. If you don’t need to do anything fancy by default the Run is mapped 1:1 into a Dataset. Horreum builds on the concept of “store data now, analyze later” - therefore rather than forcing users to pre-process the Run before upload you can change the transformation and the datasets are re-created.
If you want to do anything but upload and retrieve data from Horreum, such as customize the UI or run regression testing you need to tell Horreum how to extract data from the JSON document: in case of Horreum this is a combination of jsonpaths1 and Javascript/Typescript code. However it’s impractical to define the JSONPaths directly in the test: when you’re running the test for several months or years it is quite likely that the format of your results will evolve, although the information inside stay consistent. That’s why the data in both Run and Dataset should contain the $schema key:
{
  "$schema": "urn:load-driver:1.0",
  "ci-url": "https://my-ci-instance.example.com/build/123",
  "throughput": 4567.8
}
For each format of your results (in other words, for each URI used in $schema) you can define a Schema in Horreum. This has several purposes:
- Validation using JSON schema
- Defines Transformers: Again a set of JSON paths and Javascript function that remix a Run into one or more Datasets.
- Defines a set of Labels: a combination of one or more JSON paths and Javascript function that extracts certain data from the document. The labels let you reuse the extraction code and process data from datasets using different schemas in a unified way.
You don’t need to use all of these - e.g. it’s perfectly fine to keep the JSON schema empty or use an extremely permissive one.
In our case you could create a schema ‘Load Driver 1.0’ using the URI urn:load-driver:1.0, and a Label throughput that would fetch jsonpath $.throughput. Some time later the format of your JSON changes:
{
  "$schema": "urn:load-driver:2.0",
  "ci-url": "https://my-ci-instance.example.com/build/456",
  "metrics": {
    "requests": 1234,
    "duration": 10,
    "mean-latency": 12.3
  }
}
As the format changed you create schema ‘Load Driver 2.0’ with URI urn:load-driver:2.0 and define another label in that schema, naming it again throughput. This time you would need to extract the data using two jsonpaths $.metrics.requests and $.metrics.duration and a function that would calculate the throughput value. In all places through Horreum you will use only the label name throughput to refer to the jsonpath and you can have a continuous series of results.
You can define a label mean-latency in Load Driver 2.0 that would not have a matching one in Load Driver 1.0. You can use that label without error even for runs that use the older schema, but naturally you won’t receive any data from those.
In other cases you can start aggregating data from multiple tools, each producing the results in its own format. Each run has only single JSON document but you can merge the results into single object:
{
  "load-driver": {
    "$schema": "urn:load-driver:1.0",
    "throughput": 4567.8
  },
  "monitoring": {
    "$schema": "urn:monitoring:1.0",
    "cpu-consumption": "1234s",
    "max-memory": "567MB"
  },
  "ci-url": "https://my-ci-instance.example.com/build/123"
}
Horreum will transparently extract the throughput relatively to the $schema key. Note that this is not supported deeper than on the second level as shown above, though.
Since the jsonpath is evaluated directly in the database we use PostgreSQL jsonpath syntax ↩︎
3.3 - Users and security
User management and security
It is assumed that the repo will host data for multiple teams; each user is a member of one or more teams.
Each run, test or schema is owned by one of the teams. The team corresponds to a Keycloak role (see below) with -team suffix, e.g. engineers-team. In the UI this will be displayed simply as Engineers, dropping the suffix and capitalizing the name.
Data access
We define 3 levels of access to each item (test, run, dataset or schema):
- public: available even to non-authenticated users (for reading)
- protected: available to all authenticated users that have the
viewerrole (see below) - private: available only to users who ‘own’ this data - those who have the team role.
Users and roles
There are few generic roles automatically created during initial realm import.
viewer: read permission to view non-public runsuploader: write permission to upload new runs, useful for bot accounts (CI)tester: write permission to define tests, modify or delete data.manager: read/write permission to manage team members and their roles within the teamadmin: permission both see and change application-wide configuration such as global actions
The admin role is a system-wide role and is not restricted to a particular teams.
API Keys
Users can generate an API key, that will provide programatic access to the Horreum API with the same authorization permissions as the user who created the API Key.
User authentication
There are three possibilities to authenticate users. Users and roles can be managed in a dedicated Keycloak instance, in Horreum itself, or a mixed mode with both Horreum and an external OpenID provider.
Managed keycloak instance
In this mode users and teams are stored in a Keycloak instance that Horreum can manage. In non-production environment it can be reached it on localhost:8180 using credentials admin/secret.
Besides the team role itself (e.g. engineers-team) there must be a composite roles for each team combining the team role and permission role: bot account that uploads team’s data will have engineers-uploader which is a composite role, including engineers-team and uploader. This role cannot view team’s private data, it has a write-only access.
Users who explore runs, create and modify new tests should have the engineers-tester role; a composite role including engineers-team, tester and viewer.
You can also create a role that allows read-only access to team’s private runs, engineers-viewer consisting of engineers-team and viewer.
Horreum
It is possible to run Horreum without any external service for authentication. That is enabled with a combination of horreum.roles.provider=database while leaving the horreum.keycloak.url property undefined. This mode relies on HTTP Basic authentication. Users are managed in Horreum’s own database.
OpenID Connect (OIDC) provider
Authentication is handled by an outside OpenID provider. Users and roles are managed in Horreum and therefore the horreum.roles.provider property must be set to database. Users need to be created in Horreum with a username that match the one registererd with the OpenID provider. (It’s assumed the users are already registered with the provider, but they still need to be created in Horreum to define their teams and roles)
This mode requires setting horreum.keycloak.url and quarkus.oidc-client.auth-server-url properties, as well as the client authentication details shared by the provider. For further details on the client configuration see the Quarkus OIDC Reference Documentation on the subject.
Bootstrap account
Horreum configures one admin account when there are none. This allows the initial configuration of Horreum.
This account has horreum.bootstrap as the username and the password is secret in non-production enviroment. In production this account has a generated random password that is shown in the logs.
Once other admin accounts are created the bootstrap account should be removed.
Create User
Administrators can create users in the Administators panel and after that assign them to teams with the appropriate roles.

Team managers can also create new users on the Managed Teams panel on their user profile. The new user will be associated with the selected team.

In both cases, a form needs to be filled with the user details.

Remove User
Only Administrators can remove users. For that, navigate to the Remove Users panel and search for the users to be removed. After that click on the red Remove button and confirm.

4 - Change Detection
Details of change detection algorithms supported by Horreum
4.1 - Relative Difference of Means
Reference guide for Relative Difference of Means Change Detection
Overview
The Relative Difference of Means Change Detection algorithm is an algorithm that compares the mean of the last M results to the mean of the previous N results.
If the difference between a summary calculation of two is greater than a threshold, then a change is alerted.
Configuration
The algorithm is configured with the following parameters:
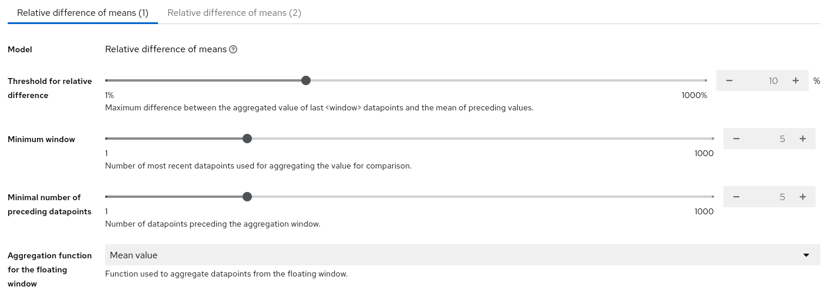
Configuration
- Threshold - The threshold of percentage difference to use to determine if a change has occurred.
- Minimum Window - The number of results to use in the mean calculation for current time window.
- Minimum Number of Preeceding datapoints - The number of preceding windows to use in the mean calculation for preceeding time window.
- Aggregation Function - The aggregation function to use when calculating the mean. The options are:
- Mean - The average of the results in the window.
- Min - The minimum of the results in the window.
- Max - The maximum of the results in the window.
Example
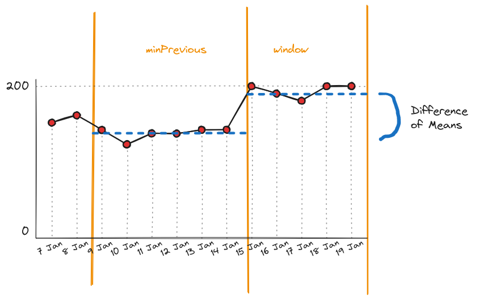
Window Configuration
NOTE: If
Minimum Number of Preeceding datapoints<Minimum Windowthen for the calculationMinimum Number of Preeceding datapointsis set equalMinimum Window
Once a change has been detected, the algorithm will wait until there is sufficient data to fill both windows so that neither contain a change before alerting again. This is to prevent alerting on every result.
Insufficient Data
If there are and insufficient number of results to calculate the mean, then the change detection algorithm will not alert. The following image shows an example of insufficient data.
In this case the change detection will wait until there are sufficient results to calculate the mean of the 2 windows.
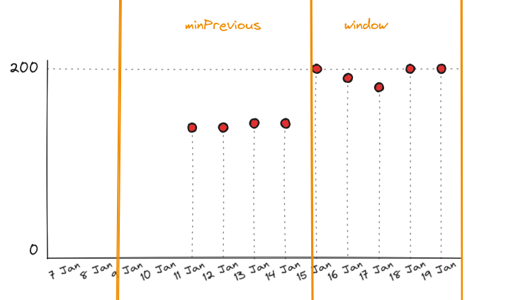
Insufficient Data
4.2 - Fixed Threshold
Reference guide for Fixed Threshold Change Detection
Overview
The Fixed Threshold Change Detection algorithm is a simple algorithm that compares the value of the last datapoint against a predefined threshold.
If the value is greater or less than the threshold, then a change is alerted.
Configuration
The algorithm is configured with the following parameters:
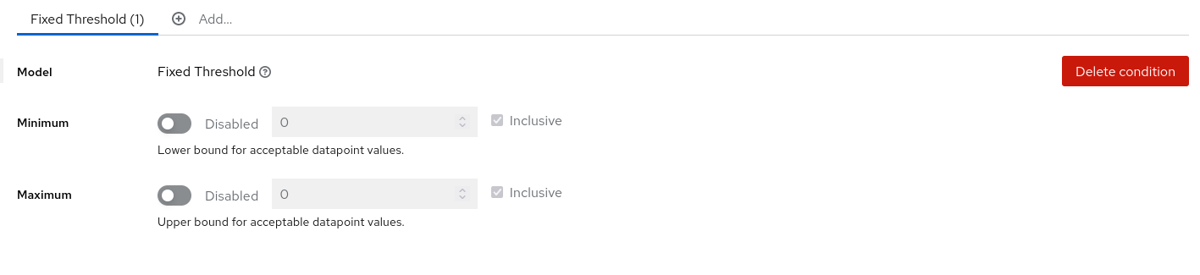
Configuration
- Minimum - The lower bound threshold to determine if a change has occurred.
- Value - Lower bound for acceptable datapoint values.
- Disabled - Whether the lower bound is enabled
- Inclusive - Is the lower bound value included in the evaluation, or are value less than the lower bound considered a change.
- Maximum - The upper bound threshold to determine if a change has occurred.
- Value - Upper bound for acceptable datapoint values.
- Disabled - Whether the Upper bound is enabled
- Inclusive - Is the upper bound value included in the evaluation, or are value more than the upper bound considered a change.
Example
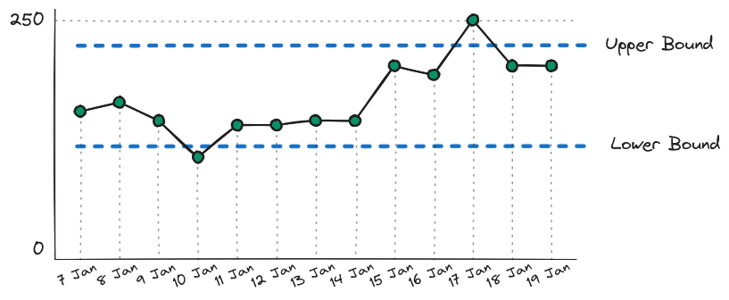
Bounds Chart
The algorithm will evaluate every datapoint against the defined bounds and raise an alert if the datapoint is outside the bounds.
Summary Bounds
Due to the data manipulation and derived metrics capability in Horreum, the bounds can be used to validate ratios, percentages, number standard deviations etc from summary statistics derived from the raw data.
Note: Bound checks do not need to be only used for simple static values.
5 - Core Tasks
Common tasks to get the most out of your Horreum installation
5.1 - API Keys
Horreum users authenticate using the Open ID Connect (OIDC) authentication protocol. However, in some circumstances it may not be possible to use OIDC. For those cases there is an alternative authentication mechanism in the form of API Keys.
API keys are tokens that grant access to certain parts of the Horreum API. In general, API Keys are associated with a user.
API Key creation
A user can manage its API Keys on the API Keys tab on the user profile (click on the name in upper right corner). The button New API Key brings up the Create new API Key dialog.

The key name is optional, but it’s recommended that every key has a name that reflects the reason it was created and/or where it’s used. At the moment the API keys give the same level of access the user has, but in the future there may be different types of keys that the user has to choose from. After the request is submitted the new key is revealed.

The user should copy the API Key, and is responsible for keeping it secret. Horreum API Keys are non-retrievable, which means they are not stored anywhere on the system. Once this dialog is closed it’s not possible to display the API key again.
API Key usage
Horreum clients allow an API Key to be specified in their configuration. Other clients need to add the X-Horreum-API-Key HTTP header with the key value. For example, the curl command to use should be:
$ curl -H 'X-Horreum-API-Key: HUSR_00000000_0000_0000_0000_000000000000' [...]
API Key management
The user can manage its own API Keys in the API Keys tab on their user profile. The fields displayed for each key are:
- Key name: The name given to the key
- Key type: The level of access the key provides
- Creation date: The date the key was created
- Last usage: The date the key was used for the last time
- Status: Shows if the key is valid or has expired / has been revoked. It also shows if the key is about to expire.

For each key there are two possible actions:
- Rename: Changes the key name
- Revoke: Remove the access rights for the key. This action can’t be undone. The user should revoke a compromised key immediately.

API Key expiration
Keys that have not been used for a while (last 30 days) are automatically revoked. Users are notified in advance using the methods provided for Personal notifications.
5.2 - Add Users and Set Roles
Add new Users and Roles to Horreum to give users permissions to manage data in Horreum
Horreum is a multi-tenanted system, hosting data for multiple teams: for a detailed discussion please see User management and security.
Users who have a -manager role (e.g. engineers-manager) can create new users, add/remove existing users to to the team and manage permissions. In order to do so visit your profile settings by clicking on your name in upper right corner, and switch to the Managed Teams tab.
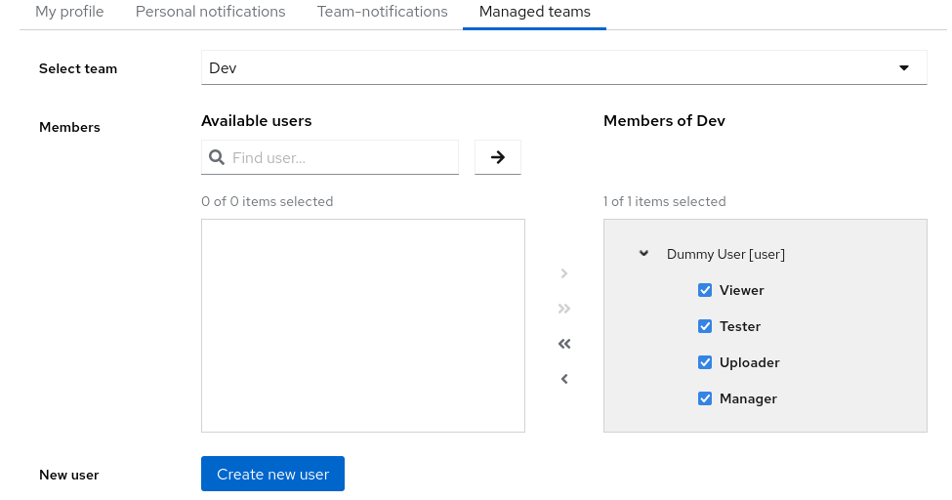
Manage Teams
From the Select team drop down, select one of teams you manage. Search for existing users in Find User.. search box and use the arrows in the middle to add or remove members of the team. Checkboxes allow you to add/remove roles for this team. When you’re finished with the changes press the Save button at the bottom.
You can also use this screen to create new users to become members of your team.
5.3 - Create new test
Create a new Test to store benchmark Run data
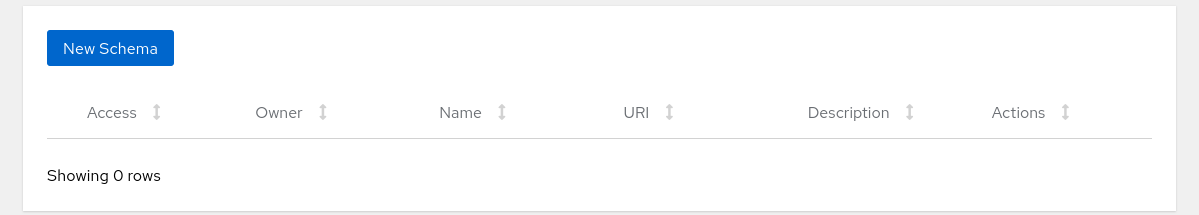
After starting Horreum and logging in you’ll find a blank table with New Test button above:
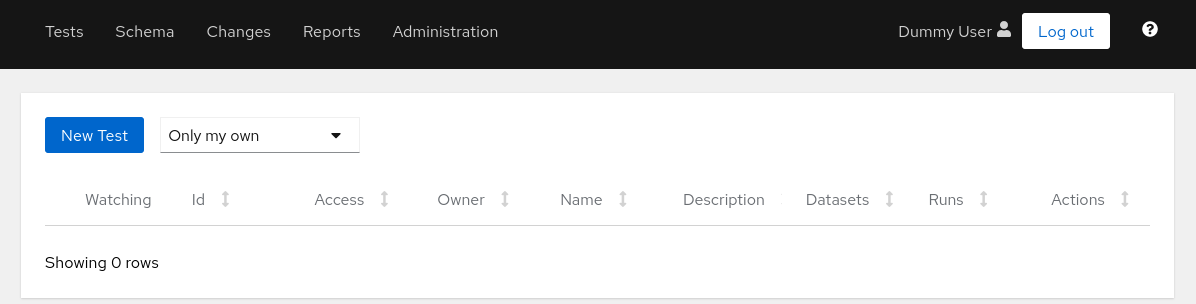
Manage Teams
All you need to fill in here is the test name. Test names must be unique within Horreum.
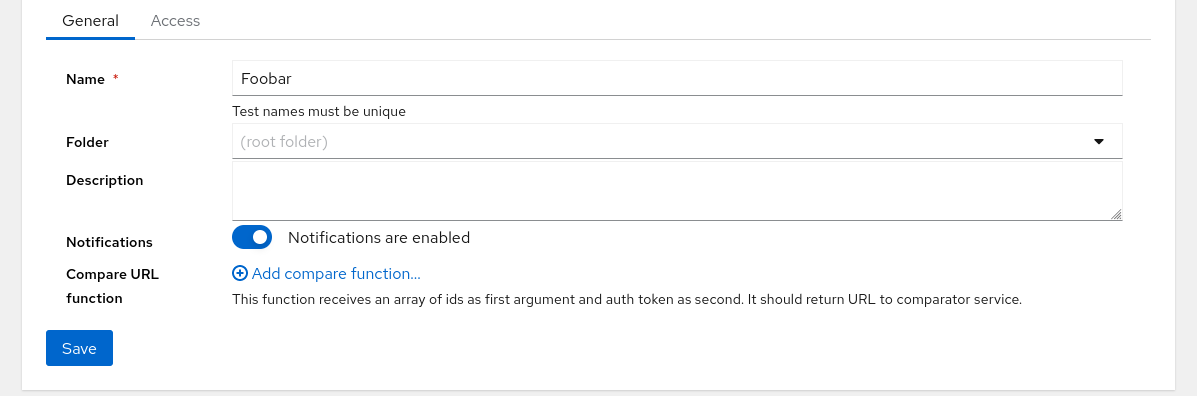
Manage Teams
When you press the Save button on the bottom several other tabs appear on the top; you can go to Access. The test was created with Private access rights; if you want anonymous users to see your tests you can set it to Public and save the test.
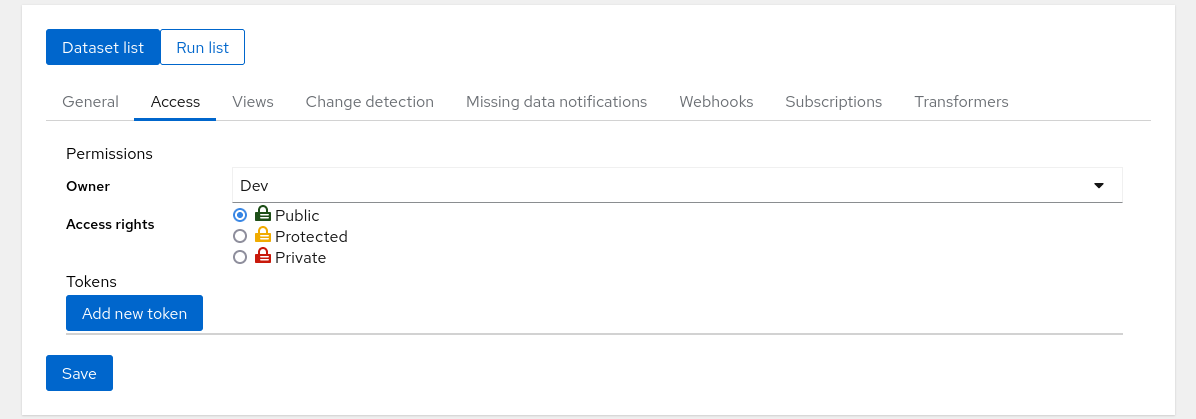
Manage Teams
When you’re done you can navigate to Tests in the bar on the top of the screen and see that the test was really created:

Manage Teams
The test is there but in the Run Count column you don’t see any runs. Now you can continue with uploading data into Horreum.
5.4 - Import and Export Tests and Schemas
How to import and export Tests and Schemas in Horreum
Background
To simplify copying Tests and Schemas between Horreum instances Horreum provides a simple API to export and import new Tests and Schemas. Horreum also support updating exising Schemas and Tests by importing Tests or Schemas with existing Id’s. For security reasons you need to be part of the team or an admin to be able to import/export Tests/Schemas.
Prerequisites:
- Horreum is running
- To export you have previously defined a
Schemafor the JSON data you wish to analyze, please see Define a Schema- To export you have previously defined a Test, please see Create new Test
Import or Export using the UI
This section explains how to import and export tests or schemas using the Horreum UI.
Export Tests or Schemas
To export a test or schema, navigate to the corresponding entity in the UI and select the “Export” tab.
Note: You must be logged in to access the “Export” tab.
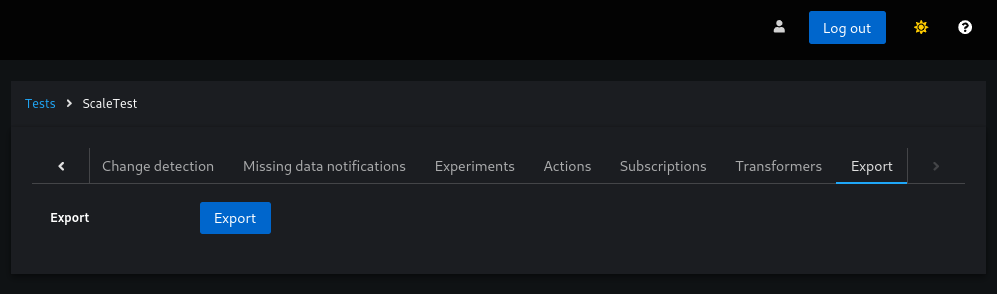
Export a test
The following are simple examples of an exported Test
{
  "variables": [],
  "missingDataRules": [],
  "experiments": [],
  "actions": [],
  "subscriptions": {
    "users": [],
    "optout": [],
    "teams": [],
    "testId": 109
  },
  "id": 123,
  "name": "ScaleTest",
  "description": "My awesome description",
  "datastoreId": null,
  "fingerprintLabels": [],
  "transformers": [],
  "notificationsEnabled": true,
  "access": "PUBLIC",
  "owner": "dev-team"
}
and an exported Schema
{
  "labels": [
    {
      "id": 3210,
      "name": "value",
      "extractors": [
        {
          "name": "value",
          "jsonpath": "$.value",
          "isarray": false
        }
      ],
      "filtering": true,
      "metrics": true,
      "schemaId": 322,
      "access": "PUBLIC",
      "owner": "dev-team"
    }
  ],
  "transformers": [],
  "id": 321,
  "uri": "urn:dummy:1.0",
  "name": "Dummy Schema",
  "description": "This schema is here just to test some functionality in production...",
  "access": "PRIVATE",
  "owner": "dev-team"
}
Import Tests or Schemas
To import a test or schema, click the “Import Test” button on either the “Tests” or “Schemas” page. The following screenshot shows the button on the “Tests” page.
Clicking the button opens a popup where you can either drag and drop your file or browse your directory to select it.
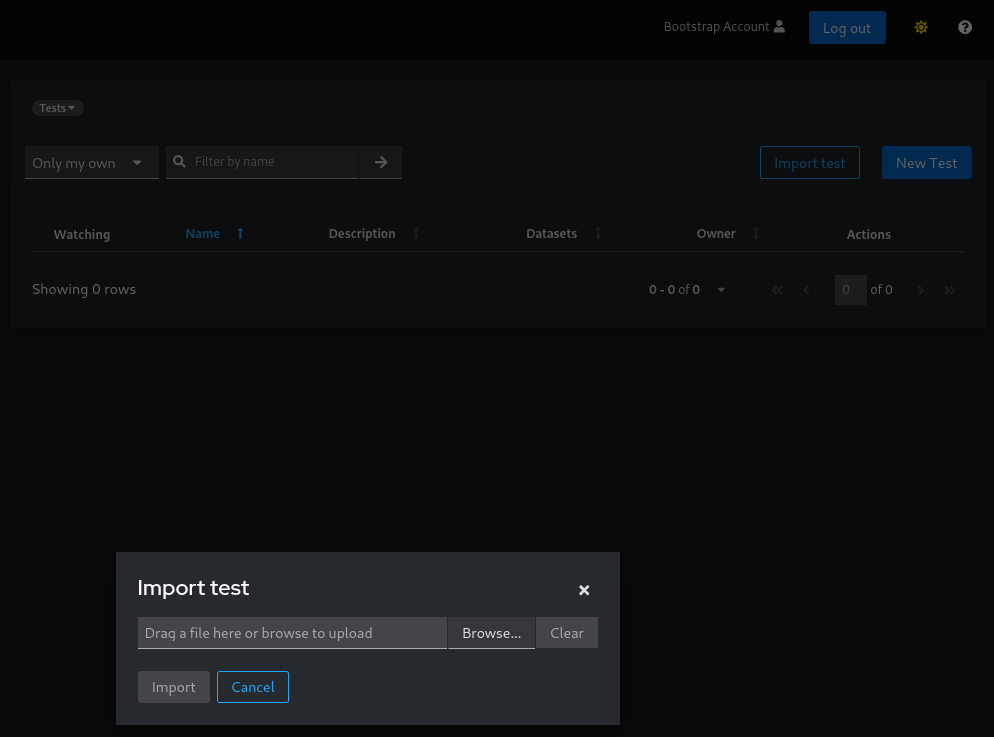
Import a test
Be aware that this functionality is used for both creating a new entity or updating an existing one, therefore that’s your responsibility to provide the correct JSON in according to what is your purpose. In order to trigger either an update or a creation, it is all about the top entity’s ID: if present the process will treat it as an update otherwise as a creation.
Important: Importing can either create a new entity or update an existing one. The process depends on the ID in the JSON:
- If the ID is present, the entity is updated.
- If the ID is missing, a new entity is created.
Make sure to provide the correct JSON format based on your intent.
Duplicate a Test or Schema
Exploiting this export/import functionalities you can easily duplicate Tests in this way:
- Export the test you want to duplicate
- Update the exported JSON by removing the top ID key (or set to
null) - Update the name of the Test, otherwise it will collide with the one you are duplicating
- Import the new JSON using the “Import test” functionality
Note: when importing a new Test, you don’t have to care about cleaning up all the IDs of the sub-entities. The process itself will care about that, so that new entities will be created.
Import or Export using the API
You can do the same using the exposed Horreum API. The only prerequisite is having a valid API Key, if you are unfamiliar with generating an API Key, please see Upload Run.
Export Schemas
API_KEY=HUSR_00000000_0000_0000_0000_000000000000
SCHEMAID='123'
curl "http://localhost:8080/api/schema/$SCHEMAID/export" -H "X-Horreum-API-Key: $API_KEY"
Export Tests
API_KEY=HUSR_00000000_0000_0000_0000_000000000000
TESTID='123'
curl "http://localhost:8080/api/test/$TESTID/export" -H "X-Horreum-API-Key: $API_KEY"
Import Schemas
curl -X POST 'http://localhost:8080/api/schema/import' \
  -H "X-Horreum-API-Key: $API_KEY" \
  -H 'content-type: application/json' \
  -d @/path/to/schema.json
Note: if you want to update an existing Test use
PUTinstead ofPOST
Import Tests
curl -X POST 'http://localhost:8080/api/test/import' \
  -H "X-Horreum-API-Key: $API_KEY" \
  -H 'content-type: application/json' \
  -d @/path/to/test.json
Note: if you want to update an existing Test use
PUTinstead ofPOST
Export objects
TestExport
The export object for Tests is called TestExport and contains a lot of other fields in addition to what’s defined in Test. This includes, variables, experiments, actions, subscriptions, datastore and missingDataRules. This is to simplify the import/export experience and make sure that all the data related to a Test has a single entrypoint in regard to import and export. Note that secrets defined on Action are not portable between Horreum instances and there might be security concerns so they are omitted. The apiKey and password attributes defined on the config field in Datastore are also omitted and will have to be manually added in a separate step.
SchemaExport
The export object for Schemas is called SchemaExport and contains other fields in addition to what’s defined in Schema. This includes, labels, extractors and transformers. This is to simplify the import/export experience and make sure that all the data related to a Schema has a single entrypoint in regard to import and export.
5.5 - Manage Reports
How to manage Reports and Report configurations in Horreum
Background
Creation of Report Configurations in Horreum is straightforward enough but deletion can be not obvious. A Report Configuration can be updated or saved as a individual Report. A useful procedure when modifying an existing Report that functions correctly.
Report Deletion
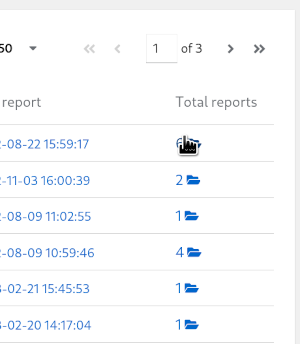
Select Report configurations
To delete an existing Report select the folder icon in the Total reports column on the Report Configuations list view. Each instance of a Report will have a red coloured button named Delete.
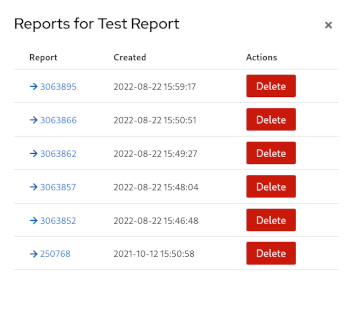
Available Report configurations
The same task can be repeated using the web API to delete a Report. Copy and paste this into your shell. Note, modify the REPORT_ID parameter. The response to expect is a 204 HTTP response code for a successful deletion.
REPORT_ID=<your_report_id_here>
curl   'http://localhost:8080/api/report/table/'$REPORT_ID   -H 'content-type: application/json' -H "X-Horreum-API-Key: $API_KEY" --request DELETE -v
5.6 - Upload Run
Horreum accepts any valid JSON as the input. To get maximum out of Horreum, though, it is recommended to categorize the input using JSON schema.
Operations are authorized via API Keys, for details on how to generate an API Key, please refer to API keys.
If you’re running your tests in Jenkins you can skip a lot of the complexity below using Horreum Plugin. This plugin supports both Jenkins Pipeline and Freeform jobs.
Uploading Data
There are several mandatory parameters for the upload:
- JSON
dataitself test: Name or numeric ID of an existing test in Horreum. You can also use JSON Path to fetch the test name from the data, e.g.$.info.benchmark.start,stop: Timestamps when the run commenced and terminated. This should be epoch time in milliseconds, ISO-8601-formatted string in UTC (e.g.2020-05-01T10:15:30.00Z) or a JSON Path to any of above.owner: Name of the owning role with-teamsuffix, e.g.engineers-team.access: one ofPUBLIC,PROTECTEDorPRIVATE. See more in data access.
Optionally you can also set schema with URI of the JSON schema, overriding (or providing) the $schema key in the data. You don’t need to define the schema in Horreum ahead, though, the validation is triggered automatically whenever you add a Run or update the schema, and you’ll see the result icon in Runs/Datasets listing for given test.
The upload itself can look like:
API_KEY='HUSR_00000000_0000_0000_0000_000000000000'
TEST='$.info.benchmark'
START='2021-08-01T10:35:22.00Z'
STOP='2021-08-01T10:40:28.00Z'
OWNER='dev-team'
ACCESS='PUBLIC'
curl 'http://localhost:8080/api/run/data?test='$TEST'&start='$START'&stop='$STOP'&owner='$OWNER'&access='$ACCESS \
    -s -X POST -H 'content-type: application/json' \
    -H "X-Horreum-API-Key: $API_KEY" \
    -d @/path/to/data.json
Assuming that you’ve created the test let’s try to upload this JSON document:
{
  "$schema": "urn:my-schema:1.0",
  "info": {
    "benchmark": "FooBarTest",
    "ci-url": "https://example.com/build/123"
  },
  "results": {
    "requests": 12345678,
    "duration": 300 // the test took 300 seconds
  }
}
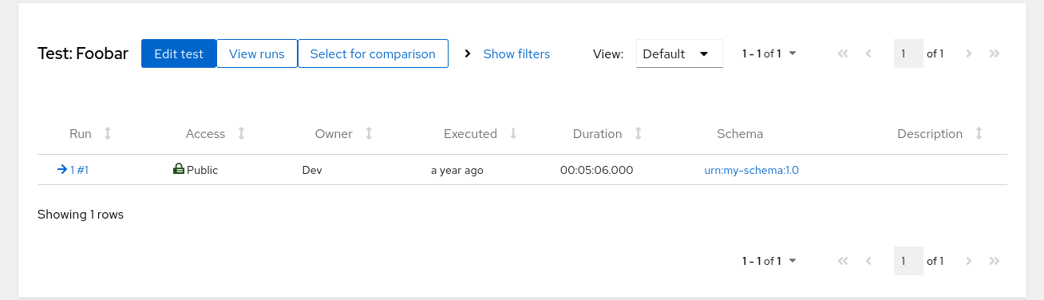
When you open Horreum you will see that your tests contains single run in the ‘Run Count’ column.
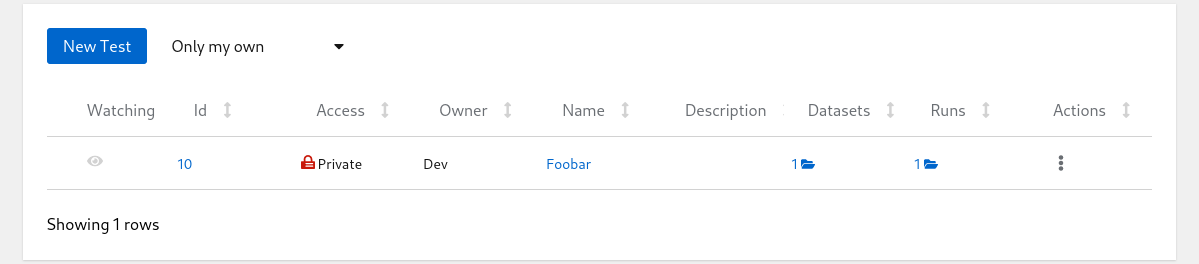
Tests List
Click on the run count number with open-folder icon to see the listing of all runs for given test:
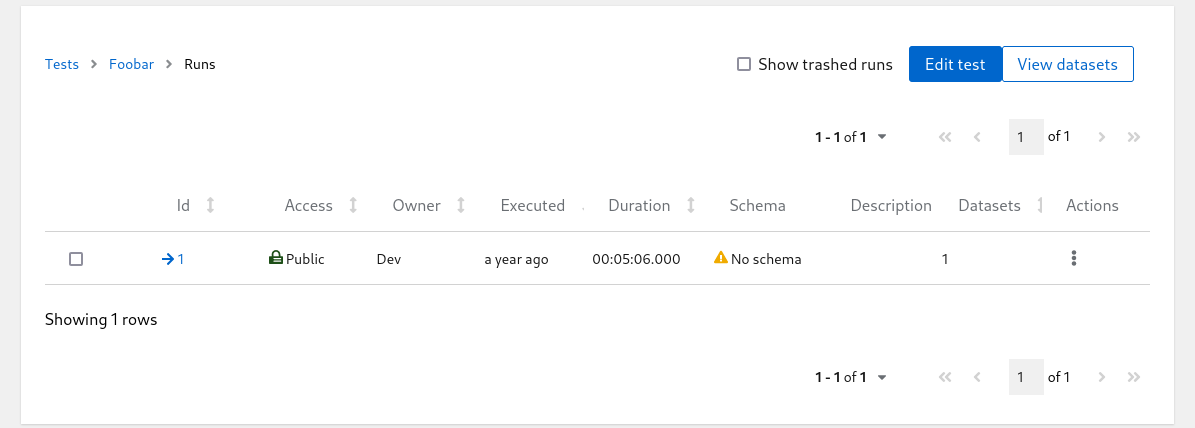
Runs List
Even though the uploaded JSON has $schema key the Schema column in the table above is empty; Horreum does not know that URI yet and can’t do anything with that. You can hit the run ID with arrow icon in one of the first columns and see the contents of the run you just created:
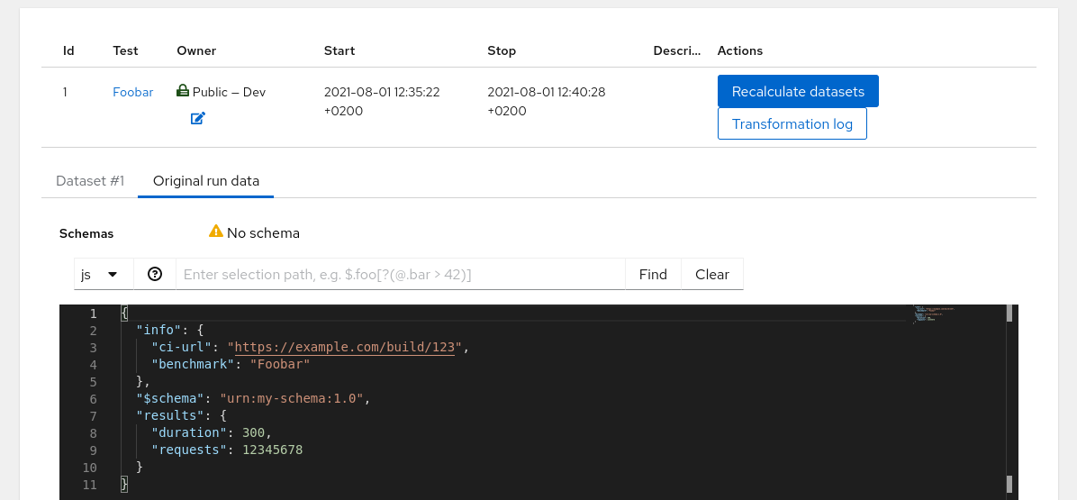
Run Details
This page shows the Original Run and an empty Dataset #1. The Dataset content is empty because without the Schema it cannot be used in any meaningful way - let’s create the schema and add some labels.
5.7 - Define Functions
Defining a Function in Horreum is commonly used to modify structure and generate new values
Prerequisites: You have already
- uploaded some data
Using Functions in Horreum is a feature that provides a great deal of bespoke functionality to Horreum that is under the control of a user. The ability to use a Function written in JavaScript.
These Functions can be categorized as:
- Selector (filter) - used for applying conditions on input data to return output data
- Transformation - used for changing the data model
- Combination - used for computing a scalar value
- Rendering - reformatting the presentation of the data
When using Horreum you will find Functions used in these Horreum objects:
| Function Type | Horreum Object | Use |
|---|---|---|
| Selector | Test | Experiment, Timeline, Fingerprint, Variable |
Report | Filtering, Category, Series, Scale Label | |
| Transformation | Schema | Transformer |
Report | Components | |
| Combination | Schema | Label, Transformer |
| Rendering | Test | View |
Report | Category, Series, Scale |
Making use of Horreum Functions
JavaScript ECMAScript 2023 specification is available throughout Horreum Functions.
Example Filtering Function
These Functions rely on a condition evaluation to return a boolean value.
The following will filter based on the individual Label Extractor only having the value 72.
value => value === 72
Example Transformation Functions
Transformation Functions rely on a returned value that is an Object, Array or scalar value.
This Transformation Function relies on 12 Extractors setup on the Schema Label. Each Extractor configured to obtain an Array of data items (except buildId and buildUrl).
Input JSON
{
  "runtimeName": "spring-native",
  "rssStartup": 55,
  "maxRss": 15,
  "avBuildTime": 1234,
  "avTimeToFirstRequest": 5,
  "avThroughput": 25,
  "rssFirstRequest": 5000,
  "maxThroughputDensity": 15,
  "buildId": "x512",
  "buildUrl": "http://acme.com",
  "quarkusVersion": "0.1",
  "springVersion": "3.0"
}
This Transformation Function uses the map JavaScript function to modify property names, the number of JSON properties and values. In the transformation runtime and buildType are created from the filtered runtimeName property. The version property is conditionally derived from runtimeName depending on the presence of the text spring.
({runtimeName, rssStartup, maxRss, avBuildTime, avTimeToFirstRequest, avThroughput, rssFirstRequest, maxThroughputDensity, buildId, buildUrl, quarkusVersion, springVersion}) => {
    var map = runtimeName.map((name, i) => ({
        runtime: name.split('-')[0],
        buildType: name.split('-')[1],
        rssStartup: rssStartup[i],
        maxRss: maxRss[i],
        avBuildTime: avBuildTime[i],
        avTimeToFirstRequest: avTimeToFirstRequest[i],
        avThroughput: avThroughput[i],
        rssFirstRequest: rssFirstRequest[i],
        maxThroughputDensity: maxThroughputDensity[i],
        buildId: buildId,
        buildUrl: buildUrl,
        version: ((name.split('-')[0].substring(0, 6) == 'spring' ) ? springVersion: quarkusVersion )
    }))
    return map;
}
Output JSON
{
  "runtime": "spring",
  "buildType": "native",
  "rssStartup": 55,
  "maxRss": 15,
  "avBuildTime": 1234,
  "avTimeToFirstRequest": 5,
  "avThroughput": 25,
  "rssFirstRequest": 5000,
  "maxThroughputDensity": 15,
  "buildId": "x512",
  "buildUrl": "http://acme.com",
  "version": "3.0"
}
Example Combination Functions
Combination Functions rely on a returned value that is an Object, Array or scalar value.
Input JSON
[5,10,15,20,10]
This Function will conditionally reduce an array of values unless there is only a single value of type number.
value => typeof value === "number" ? value : value.reduce((a, b) => Math.max(a, b))
Output JSON
20
The following example returns a scalar Float value.
Input JSON
{
  "duration": "62.5",
  "requests": "50"
}
This Function will create a value of the amount of time per request with the exponent rounded to 2 figures.
value => (value.duration / value.requests).toFixed(2)
Output JSON
1.25
Example Rendering Functions
A Rendering Function will change the presentation or add metadata for rendering in the UI.
Input JSON
Hello World
This Rendering Function adds HTML markup and sets the color of the span text.
value => '<span style="color: Tomato";>' + value + '</span>'
Output text
<span style="color: Tomato;">Hello World</span>
Troubleshooting Functions.
See the section dedicated to Troubleshooting Functions.
5.8 - Dataset Experiment Evaluation
Document explaining the use of Experiment Evaluation function in Horreum UI
Using the Dataset Experiment Evaluation View
Using the Experiment evaluation window you can quickly see the values and the relative difference of a Run.
Start by initially loading the Test. Then click the Dataset list button.
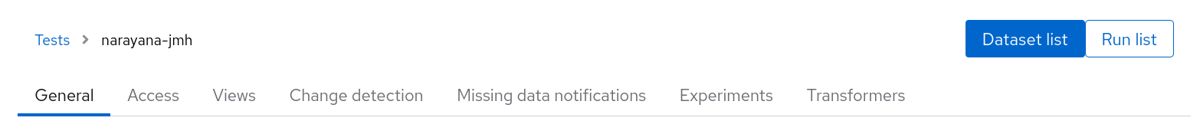
Dataset List
Then select the individual Test Run you want to compare with it’s Baseline.
By navigating to the uploaded run Dataset view page you will see a button “Evaluate experiment”. Clicking this button opens a window revealing the comparison result for the current Run and the Baseline Run..
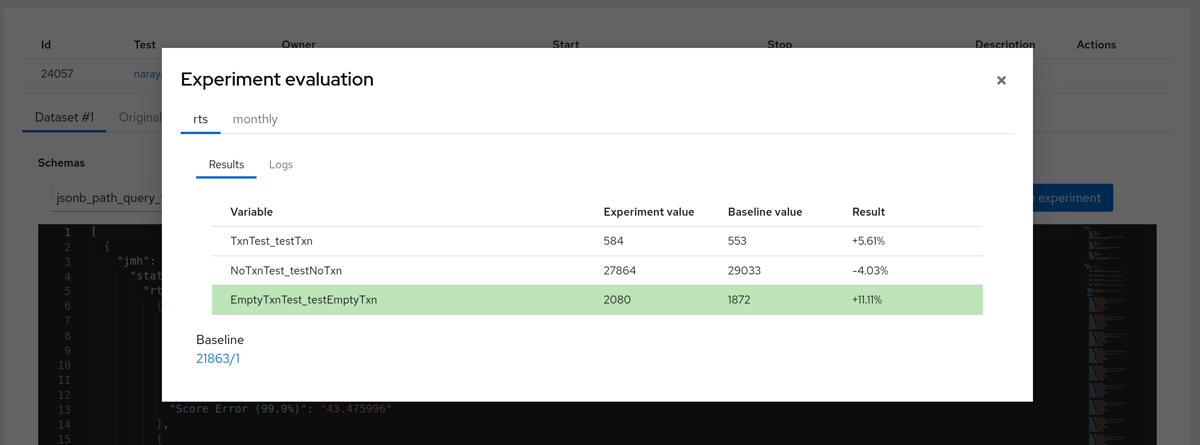
Individual Evaluation
Results show the values then the percentage difference.
Datasets Comparison View
Horreum provides multiple Run comparisons in the Dataset Comparison View. We can filter based on the Filter labels defined in the Schema.
Start by initially loading the Dataset list. Then click the button “Select for comparison”.
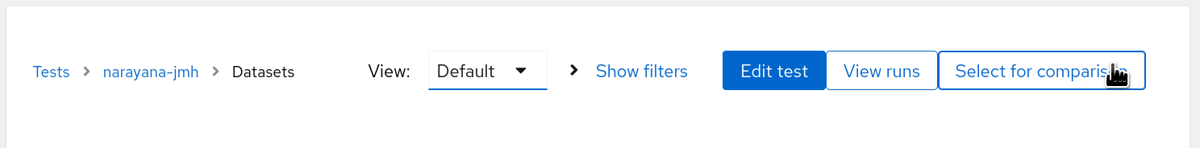
Select for comparison
Next the Comparison view is displayed. This is where filters are set.
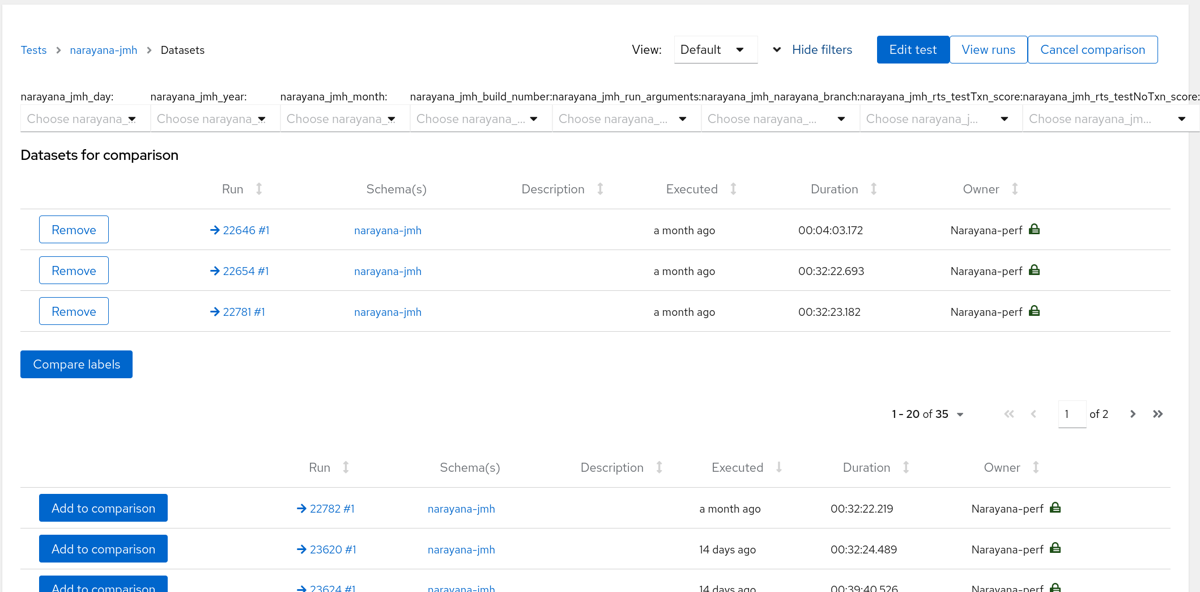
Dataset selection
Select a number of Runs to be compared using the “Add to comparison” button. Then click the “Compare labels”. Displayed next is the Labels Comparison view.
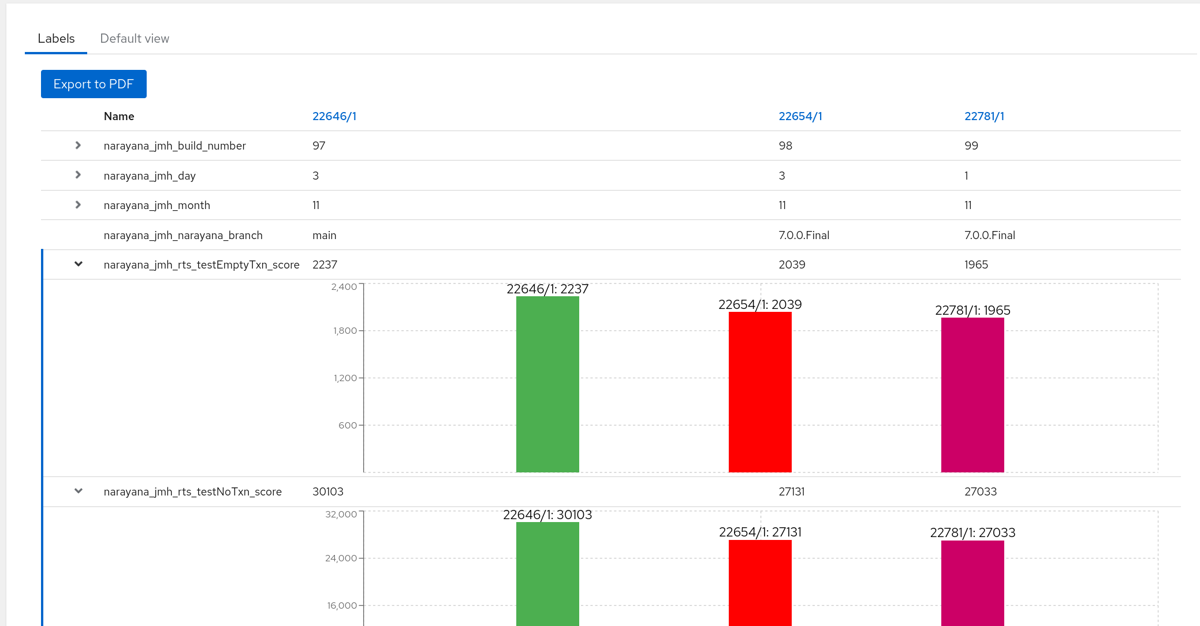
Multiple Dataset comparison
Displayed here are multiple Datasets. Schema Labels can be expanded to display a bar graph representing each Run.
In this guide two things were shown. How to compare an individual Dataset. Followed by comparing multiple Datasets.
5.9 - Transform Runs to Datasets
Horreum stores data in the JSON format. The raw document uploaded to repository turns into a Run, however most of operations and visualizations work on Datasets. By default there’s a 1-on-1 relation between Runs and Datasets; the default transformation extracts objects annotated with a JSON schema (the $schema property) and puts them into an array - it’s easier to process Datasets internally after that. It is possible to customize this transformation, though, and most importantly - you can create multiple Datasets out of a single Run. This is useful e.g. when your tooling produces single document that contains results for multiple tests, or with different configurations. With the Run split into more Datasets it’s much easier to display and analyze these results individually.
We assume that you’ve already created a test, uploaded some data and defined the Schema.
In this example we use test acme-regression with the basic schema urn:acme-schema:1.0 and uploaded JSON:
{
  "$schema": "urn:acme-schema:1.0",
  "testName": ["Test CPU1", "Test CPU2", "Test CPU3"],
  "throughput": [0.1, 0.2, 0.3]
}
Defining a Transformer
Here we will show how to define the transformation from the raw input into individual Datasets so that each testName and throughput goes to a separate set.
As the structure of the documents for individual tests (stored in Dataset) differs from the input document structure (urn:acme-schema:1.0) we will define a second Schema - let’s use the URI urn:acme-sub-schema:1.0.
Back in the acme-schema we switch to Transformers tab and add a new CpuDatasetTransformer. In this Transformer we select the acme-sub-schema as Target schema URI: the $schema property will be added to each object produced by this Transformer. An alternative would be setting the target schema manually in the Combination function below. Note that it is vital that each Transformer annotates its output with some schema - without that Horreum could not determine the structure of data and process it further.
We add two extractors: testName and _throughput_that will get the values from the raw JSON object. These values are further processed in the Combination function. If the function is not defined the result will be an object with properties matching the extractor names - the same object as is the input of this function.
As a result, the transformer will return an array of objects where each element contributes to a different DataSet.
Transformer Setup
Use transformers in the test
Each schema can define multiple Transformers, therefore we have to assign our new transformer to the acme-regression test.
Tests > Transformers
Test Transformers
After Saving the test press Recalculate datasets and then go to Dataset list to see the results. You will find 3 Datasets, each having a separate test result.
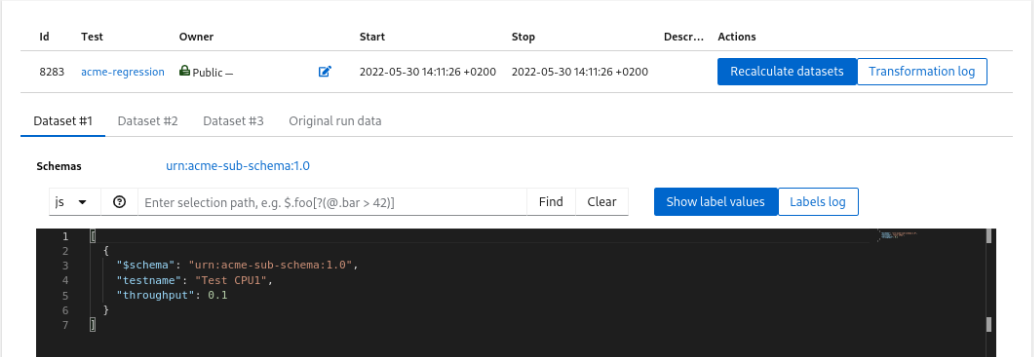
Datasets
Use labels for the fingerprint
When you’ve split the Run into individual Datasets it’s likely that for purposes of Change Detection you want to track values from each test individually. Horreum can identify such independent series through a Fingerprint: set of labels with an unique combination of values.
Go to the acme-sub-schema and define the labels testname and throughput: the former will be used for the Fingerprint, the latter will be consumed in a Change Detection Variable.
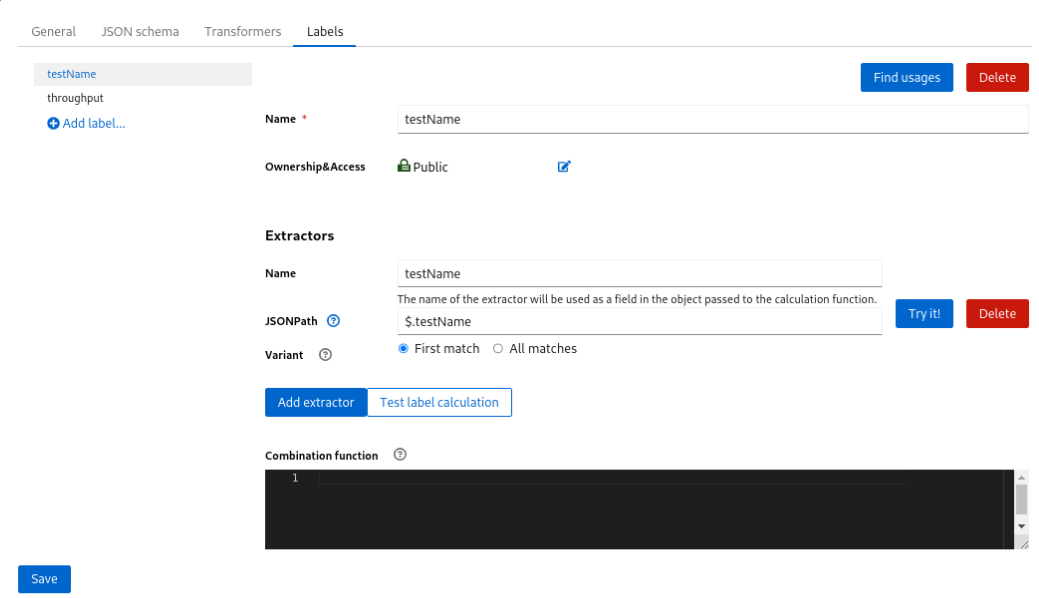
Labels
Then switch to Test > Change detection and use thos labels. The Fingerprint filter is not necessary here (it would let you exclude some Datasets from Change detection analysis.
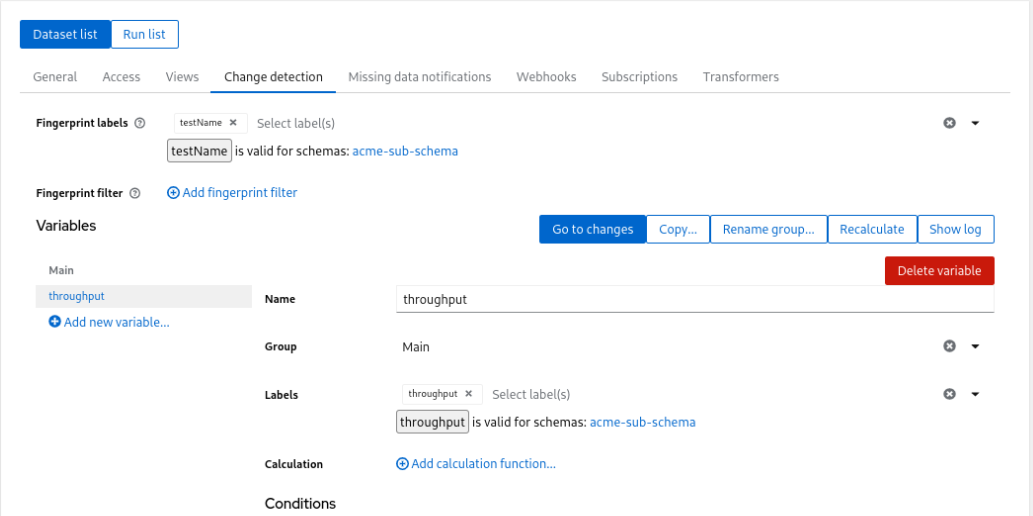
Variables
After saving and recalculation you will see the new data-points in Changes
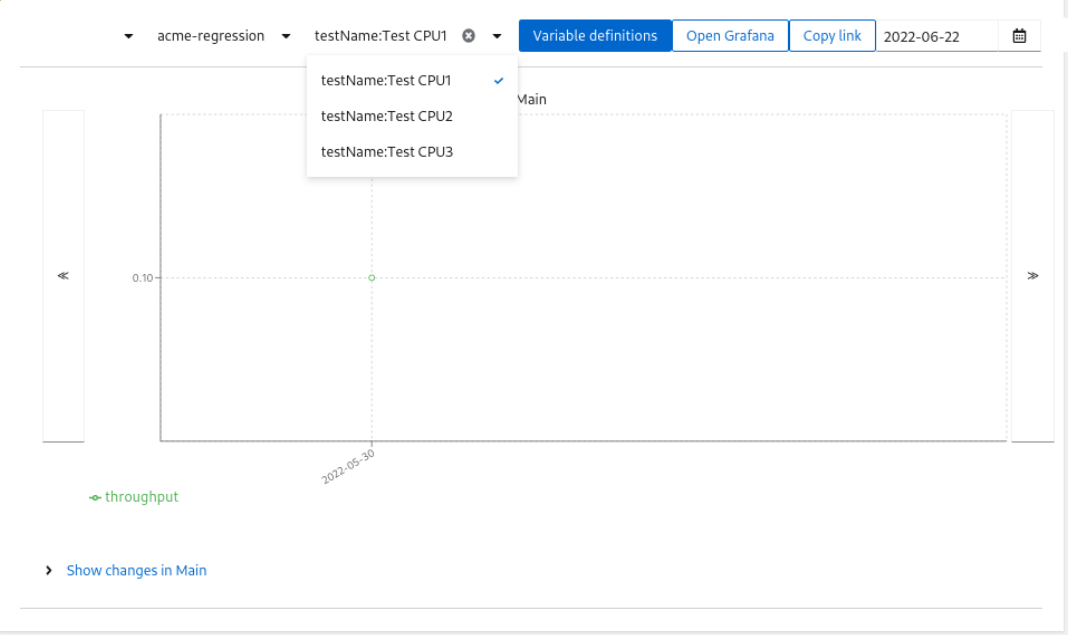
Change
In this guide we transformed the Run from the batch results arrays to individual Datasets. Then we extracted data using Labels and them for Change detection.
5.10 - Configure Change Detection
Prerequisites: You have already
- uploaded some data
- defined the Schema with some labels.
One of the most important features of Horreum is Change Detection - checking if the new results significantly differ from previous data.
Horreum uses Change Detection Variables to extract and calculate Datapoints - for each dataset and each variable it creates one datapoint.
Horreum compares recent datapoint(s) to older ones and if it spots a significant difference it emits a Change, and sends a notification to subscribed users or teams.
User can later confirm that there was a change (restarting the history from this point for the purpose of change detection) or dismiss it.
Let’s go to the test and switch to the ‘Change Detection’ tab:
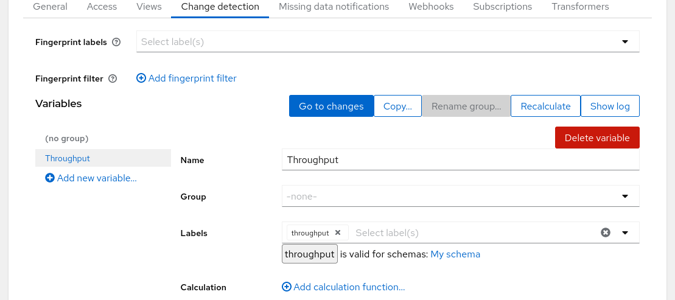
User logged in
We have created one variable Throughput using the label throughput. You could use multiple labels and combine them using a Javascript function, similar to the way you’ve combined JSON Path results when defining the label. But in this case further calculation is not necessary.
One chart can display series of datapoints for multiple variables: you can use Groups to plot the variables together. The dashboard will contain one chart for each group and for each variable without a group set.
If you scroll down to the ‘Conditions’ section you’ll find the criteria used to detect changes. By default there are two conditions: the first condition effectively compares last datapoint vs. mean of datapoints since last change, the second condition compares a mean of short sliding window to the mean of preceding datapoints, with more strict thresholds. You can change or remove these or add another criteria such as checking values vs. fixed thresholds.
The default conditions do not distinguish changes causing increase or decrease in given metric. Even if the effect is positive (e.g. decrease in latency or increase in throughput) users should know about this - the improvement could be triggered by a functional bug as well.
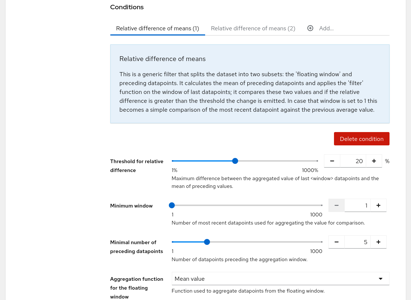
User logged in
In the upper part of this screen you see a selection of Fingerprint labels and filter; in some cases you might use the same Test for runs with different configuration, have multiple configurations or test-cases within one run (and produce multiple Datasets out of one Run) or otherwise cause that the Datasets are not directly comparable, forming several independent series of datasets. To identify those series you should define one or more labels, e.g. label arch being either x86 or arm and label cpus with the number of CPUs used in the test. Each combination of values will form an unique ‘fingerprint’ of the Dataset, had we used 3 values for cpu there would be 6 possible combinations of those labels. When a new Dataset is added only those older Datasets with the same fingerprint will be used to check against. The filter can be used to limit what datasets are suitable for Change Detection at all - you could also add a label for debug vs. production builds and ignore debug builds.
When we hit the save button Horreum asks if it should recalculate datapoints from all existing runs as we have changed the regression variables definition. Let’s check the debug logs option and proceed with the recalculation.
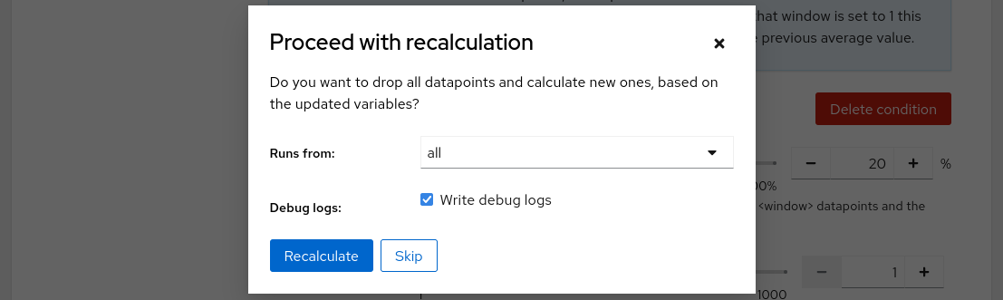
User logged in
When the recalculation finishes we can click on the ‘Show log’ button in upper right corner to see what was actually executed - this is convenient when you’re debugging a more complicated calculation function. If there’s something wrong with the labels you can click on the Dataset (1/1 in this case) and display label values and calculation log using the buttons above the JSON document.
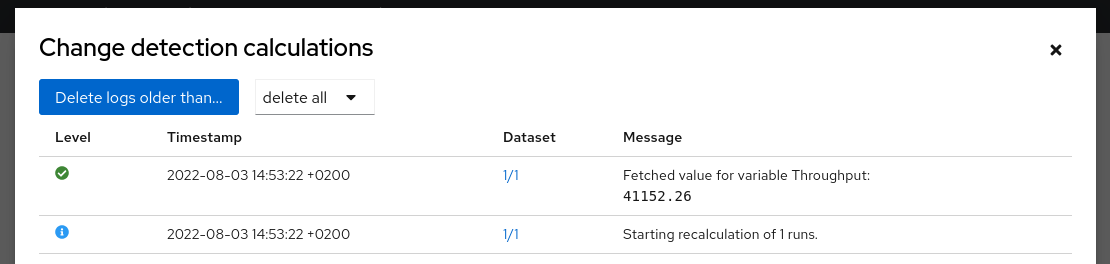
User logged in
If everything works as planned you can close the log and click the ‘Go to series’ button or use the ‘Changes’ link in navigation bar on the top and select the test in the dropbox. If the uploaded data has a timestamp older than 1 month you won’t see it by default; press the Find last datapoints button to scroll back. You will be presented with a chart with single dot with result data (we have created only one Run/Dataset so far so there’s only one datapoint).
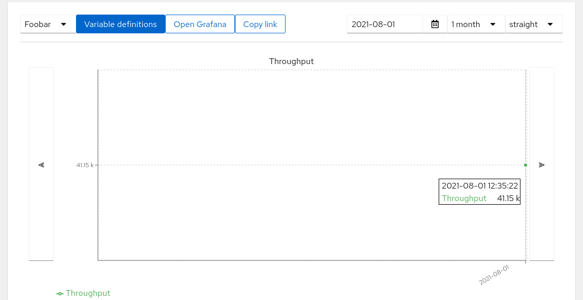
User logged in
In order to receive notifications users need to subscribe to given test. Test owner can manage all subscriptions in the ‘Subscriptions’ tab in the test. Lookup the current user using the search bar, select him in the left pane and use the arrow to move him to the right pane.
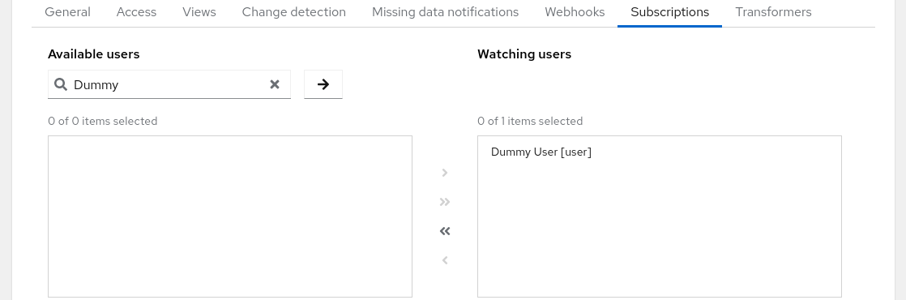
Subscriptions
You can do the same with teams using the lists in the bottom. All available teams are listed in the left pane (no need for search). When certain users are members of a subscribed team but don’t want to receive notifications they can opt out in the middle pair of lists.
When you save the test and navigate to ‘Tests’, you can notice a bold eye icon on the very left of the row. This signifies that you are subscribed. You can click it and manage your own subscriptions here as well.
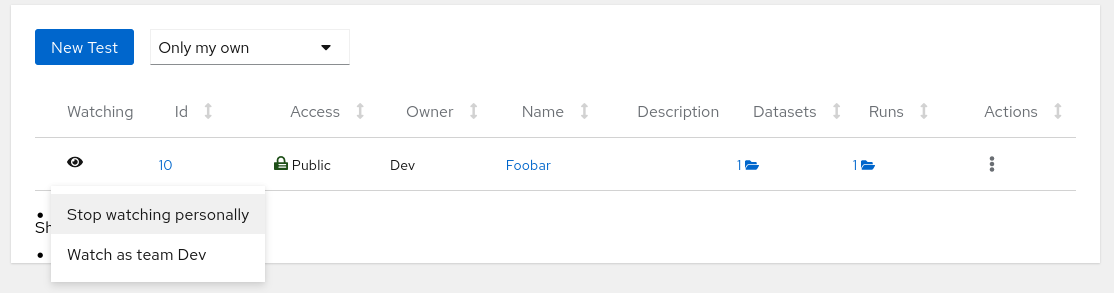
Watching
Despite being subscribed to some tests Horreum does not yet know how should it notify you. Click on your name with user icon next to the ‘Logout’ button in the top right corner and add a personal notification. Currently only the email notification is implemented; use your email as the data field. You can also switch to ‘Team notifications’ tab and set a notification for an entire team. After saving Horreum is ready to let you know when a Change is detected.
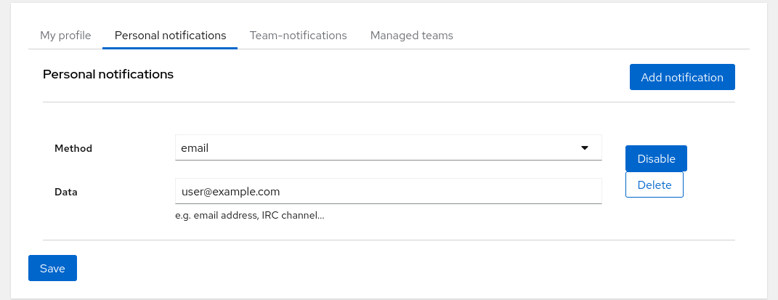
Notifications
Developers often run performance tests nightly or weekly on a CI server. After setting up the workflow and verifying that it works you might be content that you have no notifications in your mailbox, but in fact the test might get broken and the data is not uploaded at all. That’s why Horreum implements watchdogs for periodically uploaded test runs.
Go to the ‘Missing data notifications’ tab in the test and click the ‘Add new rule…’ button. If you expect that the test will run nightly (or daily) set the ‘Max staleness’ to a value somewhat greater than 24 hours, e.g. 25 h. We don’t need to filter runs using the Labels and Condition so you might keep them empty - this will be useful e.g. if you have datasets with different fingerprints. The rules are periodically checked and if there is no dataset matching the filter with start timestamp in last 25 hours the subscribed users and teams will receive a notification.
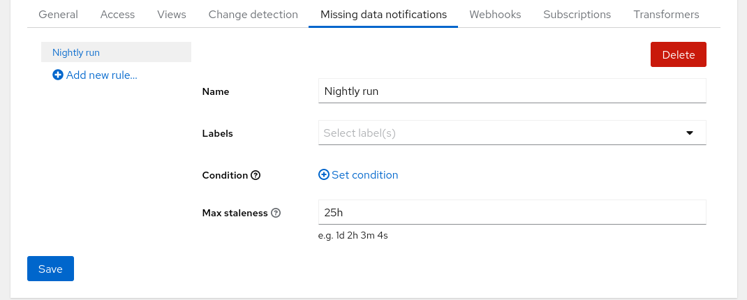
Missing Data
In the ‘General’ tab it is possible to switch off all notifications from this test without unsubscribing or changing rules. This is useful e.g. when you bulk upload historical results and don’t want to spam everyone’s mailbox.
You can continue exploring Horreum in the Actions guide.
5.11 - Configure Actions
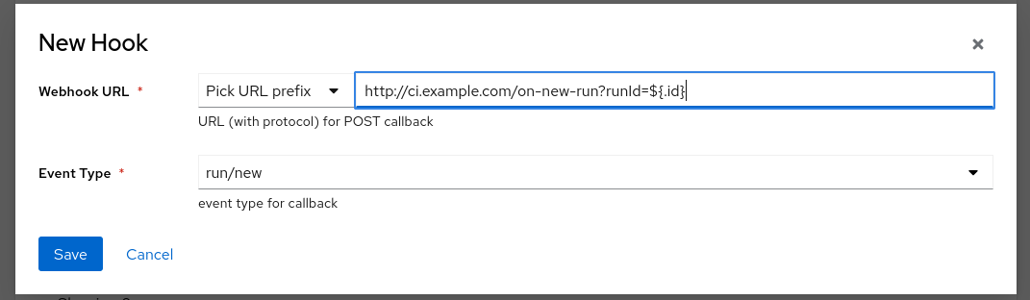
In the change detection guide you’ve seen how can you inform users about changes in your project’s performance. You can use another mechanism to notify other services about noteworthy events, e.g. bots commenting on version control system, updating status page or triggering another job in CI: the webhooks. Event Actions are produced in the following situations:
- New Run event
- New Change Detection event
- Experiment Result event
Additionally, Global Actions have one additional event type:
- New Test event
This allows remote systems or users to rely on automation that can reduce the necessity of manual tasks. Since calling arbitrary services in the intranet is security-sensitive, Horreum administrators have to set up an Action Allow list of URL prefixes (e.g. domains). There are a variety of Webhook implementations provided by Horreum:
- Generic HTTP POST method request
- Github Issue Comment
- Create a new Github Issue
- Post a message to a Slack channel
As a user with the admin role you can see ‘Administration’ link in the navigation bar on the top; go there and in the Global Actions tab hit the ‘Add prefix’ button:
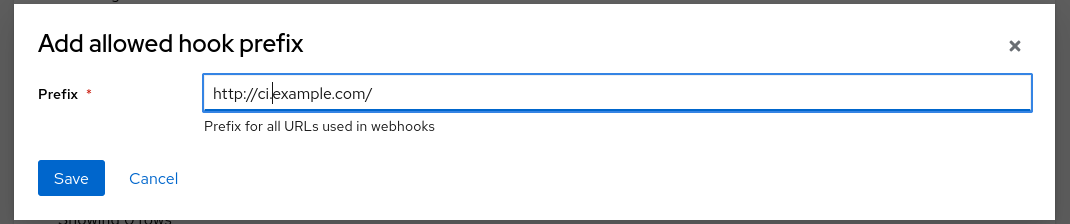
Define action prefix
When you save the modal you will see the prefix appearing in the table. Then in the lower half of the screen you can add global actions: whenever a new Test is created, a Run is uploaded or Change is emitted Horreum can trigger an action.
Test owners can set Actions for individual tests, too. Go to the Test configuration, ‘Actions’ tab and press the ‘New Action’ button. This works identically to the global actions.
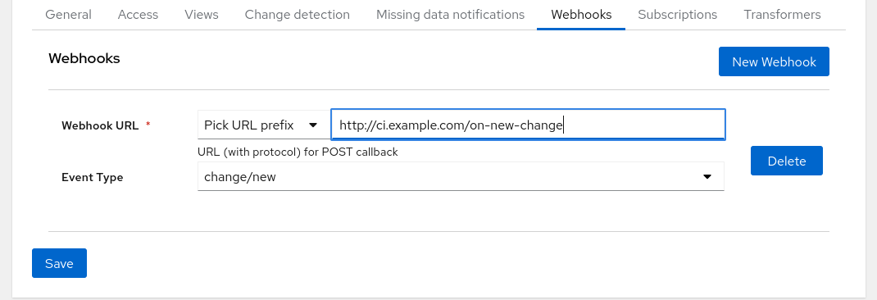
Define test webhook
Even though non-admins (in case of global hooks) and non-owners of given test cannot see the URL it is advisable to not use any security sensitive tokens.
HTTP Web Hook Action
Horreum can issue an HTTP POST request to a registered URL prefix, using the new JSON-encoded entity as a request body. You can also use a JSON path1 wrapped in ${...}, e.g. ${$.data.foo} in the URL to refer to the object sent.
Define action prefix
GitHub Issue Create Action
Horreum can create a GitHub issue against a named user (or organization) repo on a “change/new” event type. Horreum creates a GitHub formatted markdown representing the event.
You supply the owner, repository, issue title, and a GitHub token for authentication.

GitHub Issue Comment Action
Horreum can add a comment to an existing GitHub issue on an “experiment_result/new” event, identifying the issue either by owner, repo, and issue number, or by a complete GitHub URI, and a GitHub token for authentication.

Slack Channel Message Action
Horreum can post a comment to a Slack channel on a “test/new”, “change/new”, “experiment_result/new”, or “test/new” event. Horreum creates a formatted markdown representing the event.
You supply the Slack channel ID, and a Slack app OAuth token.

In this case the JSON path is evaluated in the application, not in PostgreSQL, therefore you need to use the Jayway JSON Path syntax - this is a port of the original Javascript JSON Path implementation. ↩︎
5.12 - Re-transform a Run
Re-transforming Dataset(s) in a Run is useful after any of the following tasks are completed in Horreum
- Changed the selection of Transformers in a Test
- Changed a Transformer’s definition
- Changed Schema
While re-transforming isn’t necessary for existing Dataset(s) to continue operating normally an update with the latest derived values is useful to resolve any issues with incomplete derived values. These are the steps for a Run:
- Navigate to the Test Run List
- Select the individual Run
- Click the blue coloured button with the text “Re-transform datasets”
Runs List
Alternatively, on the Test edit page
- Select the Transformers tab
- Click the Re-transform datasets button
- Accept the prompt to re-transform datasets by clicking the button
Runs List
Retrabsform confirmation prompt
5.13 - Define a Schema
Define a Horreum schema to provide the meta-data to allow Horreum to process Run data
Prerequisites: You have already
- uploaded some data
In order to extract data from the Run JSON document we need to annotate it with $schema and tell Horreum how to query it.
Make sure that you’re logged in, on the upper bar go to Schemas and click ‘New Schema’ button:
User logged in
Fill in the name and URI (urn:my-schema:1.0 if you’re using the uploaded example) and hit the Save button on the bottom.
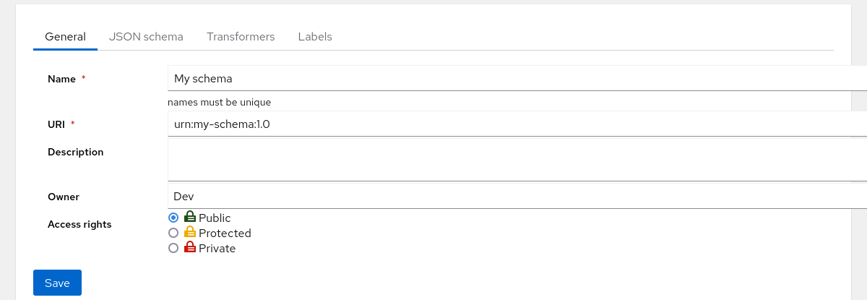
User logged in
Switch tab to ‘Labels’ and add two labels: let’s call first ci-url where you’d extract just single item from the JSON document using PostgreSQL JSON Path $.info."ci-url". In that case you can ignore the combination function as you don’t need to combine/calculate anything. You can uncheck the ‘filtering’ checkbox as you likely won’t search your datasets based on URL.
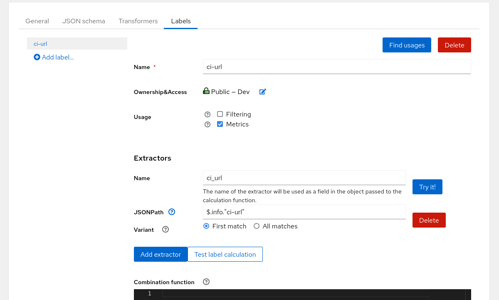
User logged in
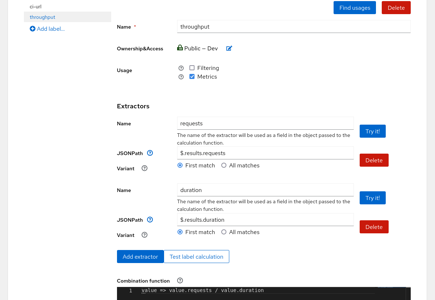
Combination Functions
In the situation a derived metric is necessary the Combination Function is used to calculate the value.
Here we create a seperate Label called throughput and we extract two elements from the JSON document: requests using $.results.requests and duration using $.results.duration. In this case the input to the calculation function will be an object with two fields: requests and duration. You can get throughput by adding combination function (in JavaScript) in the lambda syntax value => value.requests / value.duration. Had we used only one JSON Path the only argument to the function would be directly the result of the JSON Path query.
Note that this function is calculated server-side and it is cached in the database. It is automatically recalculated when the label definition changes; the datasets are processed asynchronously, though, so there might be some lag.
User logged in
Finally hit the Save button, go to Tests and in the table click on the 1 with folder icon in Datasets column. (Note that by default a Run produces single dataset - more about this in Transform Runs into Datasets. This will bring you to the listing of datasets in this test, and this time you can see in Schema tab that the schema was recognized.
User logged in
However you still don’t see the labels - for that click on the ‘Edit test’ button and switch to ‘Views’ tab. The ‘Default’ View is already created but it’s empty; hit the ‘Add component’ button on the right side twice and fill in the columns, using the labels we’ve created before. We can further customize the ‘Throughput’ by adding the “reqs/s” suffix. Note that this function can return any HTML, this will be included into the page as-is. The rendering happens client-side and you have the dataset entity (not just the JSON document) as the second argument to the render function. Third argument would be your personal OAuth token.
It’s not necessary to turn URLs into hyperlinks, though; Horreum will do that for you.
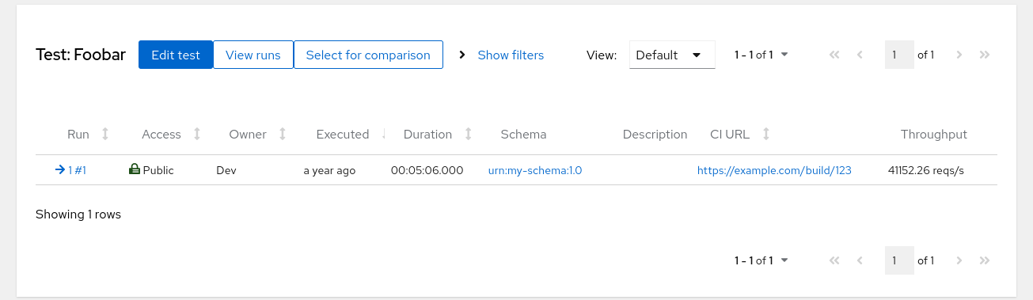
User logged in
To see the result click on the Save button and then on ‘Dataset list’ in the upper part. Now you’ll see the CI link and throughput columns in place. If the labels are not calculated correctly you can enter the Dataset by clicking on its ID in the Run column and explore Label values through the button above the JSON document. If there was e.g. a syntax error in the Javascript function you could find an error in the ‘Labels log’ there, too.
User logged in
You might be wondering why you can’t set the JSON path directly in the view; Concepts explains why this separation is useful when the format of your data evolves. Also, label defined once can be used on multiple places, e.g. for Change Detection.
6 - Integrations
Horreum Integrations
Details of Integrations with Horreum
6.1 - Collector API
Use Collector API to query JSON for analysis
If you have a lot of data already stored in a Collector instance, you can query it and analyze the data for regressions in Horreum.
Configuration
To configure a test to use the Collector API backend, you need to be a team administrator. With the correct permissions, you can:
- Generate a new API key for the
Collector APIbackend: Please see the collector docs on how to Create a new API token - Navigate to
Administration->Datastoresconfiguration page, e.g.http://localhost:8080/admin#datastores - Select the
Teamfrom theTeamdropdown that you wish to configure - Click
New Datastore
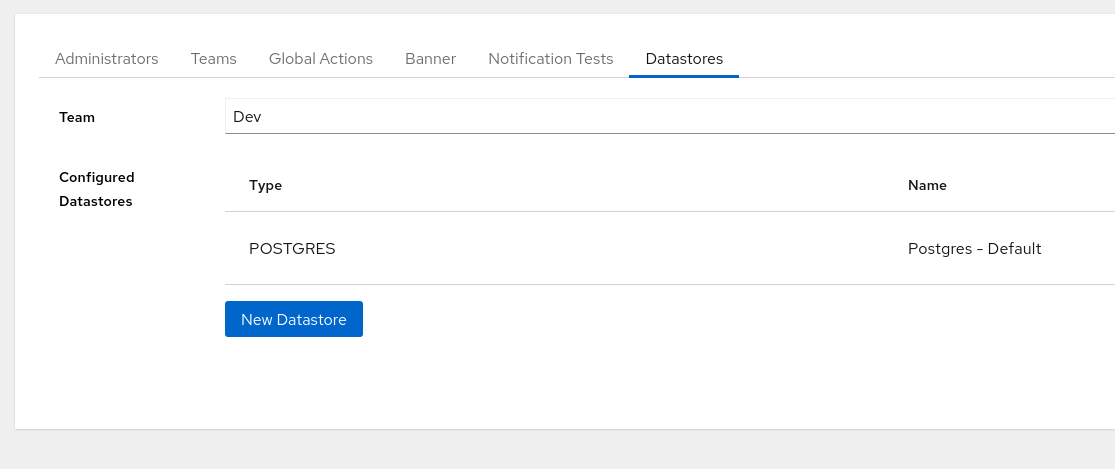
New Datastore
- Configure the
Collector APIDatastore:
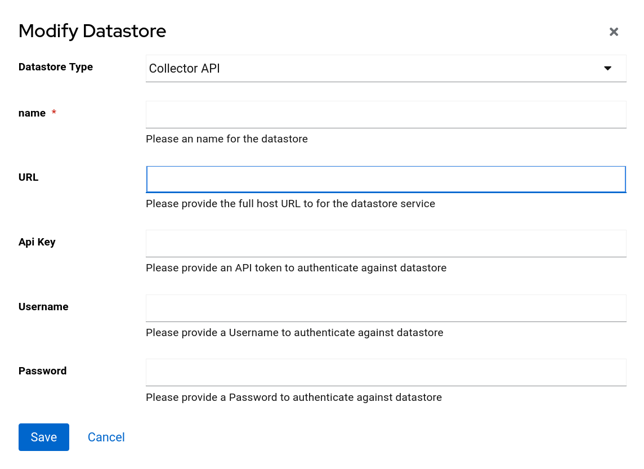
New Collector API Datastore
1. Select `Collector API` from the `Datastore Type` dropdown
2. Provide a `Name` for the Datastore
3. Enter the `URL` for the Collector instance
4. Enter the `API Key` for the Collector instance, generated in step 1
5. Click `Save`
Test Configuration
To configure a test to use the Collector API backend, you can:
- Navigate to a test configuration page, e.g.
http://localhost:8080/test/10 - Select the
Collector APIbackend defined in theDatastoresconfiguration from theDatastoredropdown
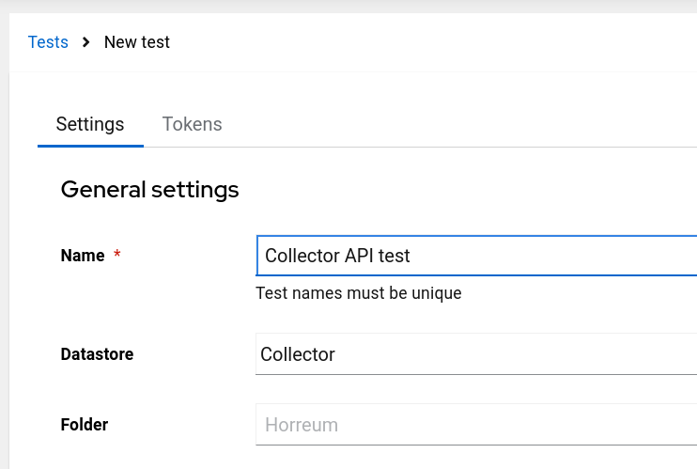
Configure Test
- Click
Save
6.2 - Slack
Using Actions to post updates to Slack
Horreum can be configured to post messages to a Slack channel through the
slack-channel-message action. Actions can be triggered on various Horreum
lifecycle events: see Configure Actions
for details.
Configuration
Before you can configure a Slack action, either globally or for a specific test, you’ll need to create and install a “Slack application” as a bot allowed to post messages to a specific Slack channel.
- Create a Slack App. You can do this through the Slack development CLI, or by clicking “Create New App” on the web interface at Slack Apps:

- Open the “OAuth & Permissions” tab and scroll down to the “Scopes” header.
Add your scopes by clicking on the “Add an OAuth Scope” button. The Horreum
Slack Action requires the
channels:joinandchat:writescopes:

- Once you’ve created the app, you’ll need to install it in your Slack workspace. Depending on the workspace, you may need to request approval from a workspace administrator:

- Once installation is complete, Slack will give you a “BotUser OAuth Token”; a
long string that should start with “xoxb-”. This token identifies and authenticates
your app (in this case, the Horreum server) to Slack, and you’ll need to provide
this value to Horreum as the
tokensecret when configuring an Action.

- Now you need to give your app permission to post to your chosen Slack channel by using your token to “join” the channel. In the Slack UI (either the web UI or in the Slack app), you can right-click on the channel and choose “View channel details”. At the bottom of the sheet that opens you should see an alphanumeric string labeled “Channel ID”, with a “copy to clipboard” icon following the value.

Navigate to the online conversations.join Test API and enter the OAuth bot token and the Channel ID in the input boxes, and click “Test method”. You should get a success API response, and you (and Horreum) can now use your OAuth token to post bot messages to the designated Slack channel ID.

Configuring a Horreum Slack Action
Using either the API or the UI, you can create a Slack Action globally or for a specific Test. You will supply both the Slack channel ID and the Slack App bot token you created earlier, along with specifying the particular event and formatted template you want to post.
TBD
6.3 - ElasticSearch
Use ElasticSearch to query JSON for analysis
If you have a lot of data already stored in an Elasticsearch instance, you can query it and analyze the data for regressions in Horreum.
Configuration
To configure a test to use the elasticsearch backend, you need to be a team administrator. With the correct permissions, you can:
- Generate a new API key for the
elasticsearchbackend: Please see the elasticsearch docs on how to generate an API key on the Management page - Navigate to
Administration->Datastoresconfiguration page, e.g.http://localhost:8080/admin#datastores - Select the
Teamfrom theTeamdropdown that you wish to configure - Click
New Datastore

New Datastore
- Configure the
ElasticsearchDatastore:
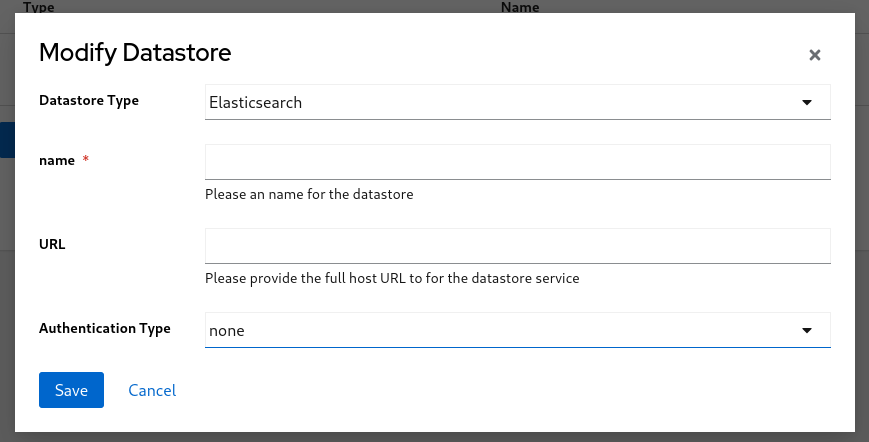
New Datastore
- Select
Elasticsearchfrom theDatastore Typedropdown - Provide a
Namefor the Datastore - Enter the
URLfor the Elasticsearch instance - Select
api-keyfromAuthentication Typefrom dropdown - Enter the
API Keyfor the Elasticsearch instance, generated in step 1 - Click
Save
Test Configuration
To configure a test to use the elasticsearch backend, you can:
- Navigate to a test configuration page, e.g.
http://localhost:8080/test/10 - Select the
Elasticsearchbackend defined in theDatastoresconfiguration from theDatastoredropdown
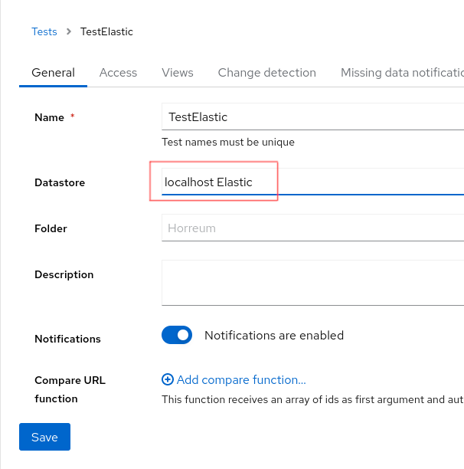
Configure Test
- Click
Save
6.4 - Jenkins
Use the Jenkins Plugin to upload data directly to Horreum from a Jenkins pipeline
Details of the Jenkins Plugin can be found on the Horreum Plugin Github Repository
6.5 - Postgres
Postgres as the datasource to store JSON documents
By default, the datasource is configured to use the postgres database backend.
Data submitted to the Horreum API will be stored in a Postgres database, alongside all the metadata required to query and retrieve the data.
Query results from other datasources will be cached in the same postgres database.
Configuration
To configure a test to use the postgres backend, you can:
- Navigate to a test configuration page, e.g.
http://localhost:8080/test/10 - Select the
Postgres - Defaultbackend from theDatastoredropdown
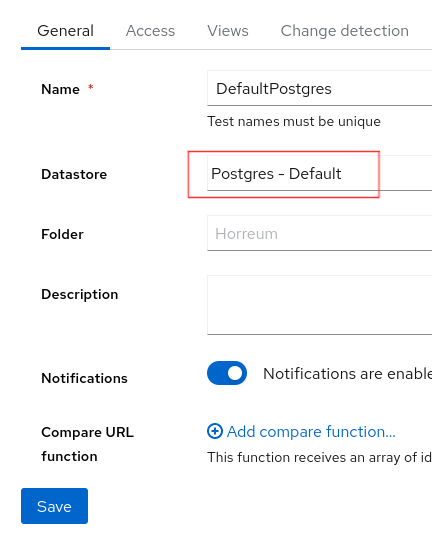
Postgres Datastore
- Click
Save
Migrating Data from Other Backends
If you wish to migrate data from one backend store to the postgres backend, you can configure a Test to retrieve the data from the old backend and submit it to the Horreum API.
Once the data has been cached, you can then use the postgres backend as the Test backend and any new data pushed to Horreum will be analyzed alongside the migrated data.
6.6 - Grafana
Configure Horreum as a datasource in Grafana
Grafana is a popular tool for visualizing time series data. Horreum can be configured as a datasource in Grafana to allow you to view the data processed by Horreum.
Prerequisites:
- Horreum is running, and you are logged in
- You have access to a running Grafana instance. If you do not have an environment available, please follow the official documentation for your platform.
Configure Horruem as a Datasource
1. Install the JSON Datasource plugin for Grafana
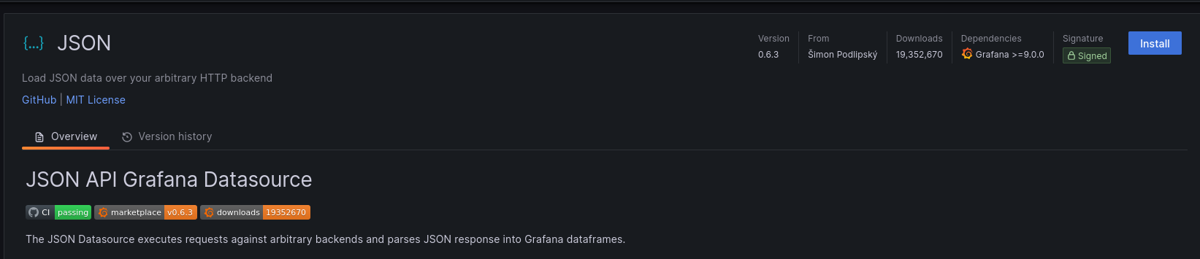
Install JSON Grafana Plugin
2. Add new Datasource
2.1 Click “Add new data source” button
Click “Add new data source”
2.2 Configure Horreum as a Datasource
Configure the datasource as follows:
- Name: Horreum
- URL: https://<horreum_host>/api/changes
- Access: Server (Default)
- Forward OAuth Identity: checked
Click “Save & Test” button
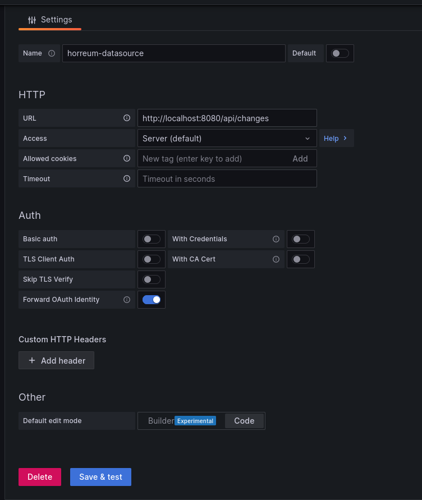
Configure Horreum JSON Datasource
If successful, you should see the following message:
Datasource Successful
Querying Horreum data
Now that you have Horreum configured as a datasource, you can query the data in Horreum from Grafana.
1.1 Create a new Dashboard
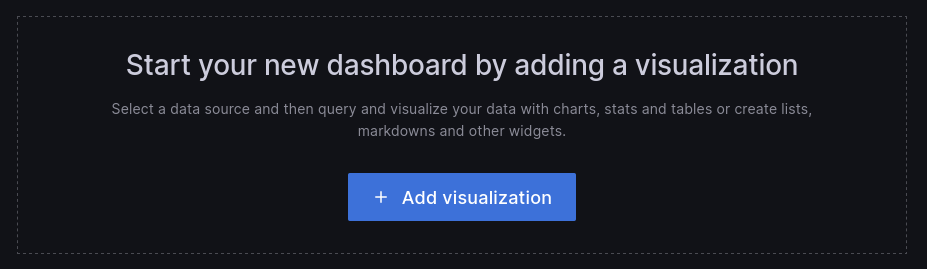
Create new Dashboard
2.2 Add Horreum as Datasource
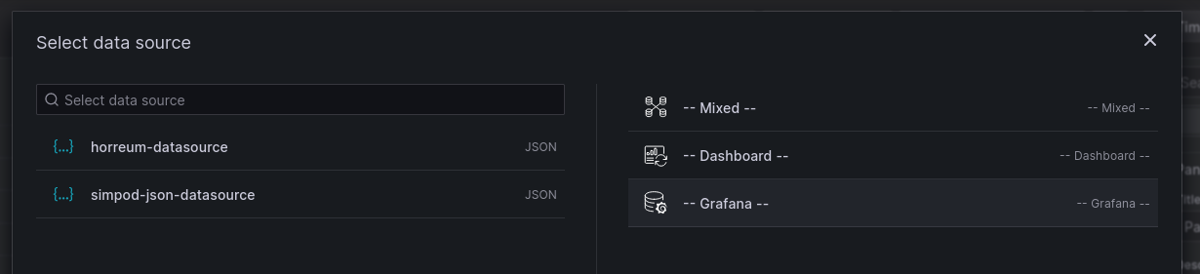
Select Horreum Datasource created in previous step
2.3 Provide a name for the new Panel
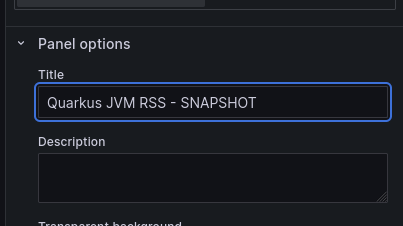
Set panel name
2.4 Define query
Horreum provides an API that Grafana can natively query.
In order for Grafana to query Horreum, you must provide a Metric payload that defines the query.
The Metric is a String that consists of the Variable ID and Fingerprint seperated by a semi-colon ;.
e.g. Metric : 23219;{"buildType":"SNAPSHOT"}
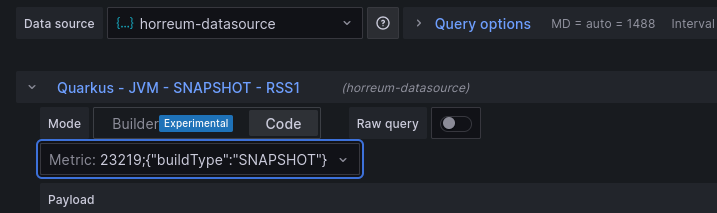
Define query metric
2.5 Save panel

Save panel
2.5 View Dashboard
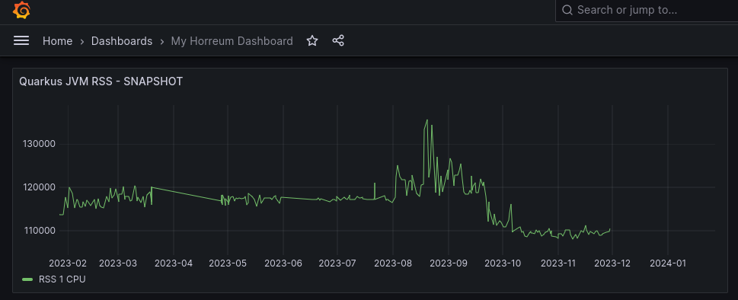
View Dashboard
7 - Deployment
Horreum Deployment Guides
Get Horreum running locally and upload your first data
7.1 - Bare-metal
Install Horreum on a bare-metal machine
This guide documents production installation without helper *-compose scripts.
Setup database
You need PostgreSQL 12 (or later) installed; setup is out of scope of this guide.
PostgreSQL must be installed with SSL support. In short, you’ll need to setup at least the following SSL properties: ssl=on, ssl_cert_file and ssl_key_file. Horreum will also use the server certificate file in order to verify the connection.
Create a new database for the application called horreum and limited-privilege user appuser with a secure password:
export PGHOST=127.0.0.1
export PGPORT=5432
export PGUSER=dbadmin
export PGPASSWORD="Curr3ntAdm!nPwd"
psql -c "CREATE DATABASE horreum" postgres
export PGDATABASE=horreum
psql -c "CREATE ROLE \"appuser\" noinherit login password 'SecurEpaSSw0!2D';" postgres
Now you need to setup a Keycloak user and database:
psql -c "CREATE ROLE \"keycloakuser\" noinherit login password 'An0th3rPA55w0rD';"
psql -c "CREATE DATABASE keycloak WITH OWNER = 'keycloakuser';"
Keycloak setup
For complete Keycloak setup please refer to Keycloak Getting Started - you can also use existing Keycloak instance.
Get the realm definition and import it:
REALM_CONFIG=$(mktemp horreum-docker-compose.XXXX.yaml)
curl https://raw.githubusercontent.com/Hyperfoil/Horreum/master/infra/keycloak-horreum.json \
    -s -o $REALM_CONFIG
./bin/standalone.sh \
    -Dkeycloak.profile.feature.upload_scripts=enabled \
    -Dkeycloak.migration.action=import \
    -Dkeycloak.migration.provider=singleFile \
    -Dkeycloak.migration.file=$REALM_CONFIG \
    -Dkeycloak.migration.strategy=IGNORE_EXISTING
When Keycloak starts you should access its admin console and adjust URLs for clients horreum and horreum-ui:
- Root URL (
rootUrl) - Valid Redirect URIs (
redirectUris) - make sure to include the/*to match all subpaths - Admin URL (
adminUrl) - Web Oridins (
webOrigins)
After that create the role __user_reader, go to ‘Role Mappings’ tab, select realm-management in Client Roles and give this user the view-users role. Make sure that this user has the offline_access Realm Role as well.
Now you can create team roles, users and assign them appropriately. For correct integration with Grafana please remember to set email for each user (this will be used purely to match Grafana identities).
You should also open horreum client, switch to ‘Credentials’ tab and record the Secret (UUID identifier).
Starting Horreum
Horreum is a Quarkus application and is configured using one of these:
- Java system properties when starting the application
- Exported environment variables
- Environment variables definition in
.envfile in the current working directory
You should set up these variables:
# --- DATABASE ---
# These two URLs should be identical
QUARKUS_DATASOURCE_MIGRATION_JDBC_URL=jdbc:postgresql://db.local:5432/horreum
QUARKUS_DATASOURCE_JDBC_URL=jdbc:postgresql://db.local:5432/horreum
# This is the regular user Horreum will use for DB access
QUARKUS_DATASOURCE_USERNAME=appuser
QUARKUS_DATASOURCE_PASSWORD=SecurEpaSSw0!2D
# This is the user that has full control over 'horreum' database
QUARKUS_DATASOURCE_MIGRATION_USERNAME=dbadmin
QUARKUS_DATASOURCE_MIGRATION_PASSWORD=Curr3ntAdm!nPwd
# The database server SSL certificate
QUARKUS_DATASOURCE_JDBC_ADDITIONAL-JDBC-PROPERTIES_SSLROOTCERT=server.crt
# As an alternative, certificate validation can be disabled with
# QUARKUS_DATASOURCE_JDBC_ADDITIONAL-JDBC-PROPERTIES_SSLMODE=require

# --- KEYCLOAK ---
# This URL must be accessible from Horreum, but does not have to be exposed to the world
QUARKUS_OIDC_AUTH_SERVER_URL=https://keycloak.local/auth/realms/horreum
# You might need to set this property to the external Keycloak URL
QUARKUS_OIDC_TOKEN_ISSUER=https://keycloak.example.com
# Secret found in Keycloak console
QUARKUS_OIDC_CREDENTIALS_SECRET=xxxxxxxx-xxxx-xxxx-xxxx-xxxxxxxxxxxx
# Make sure to include the /auth path. This URL must be externally accessible.
HORREUM_KEYCLOAK_URL=https://keycloak.example.com/auth
# Keycloak URL for internal access
HORREUM_KEYCLOAK_MP_REST_URL=https://keycloak.local

# --- Grafana ---
HORREUM_GRAFANA_ADMIN_PASSWORD=g12aPHana+Pwd
# External Grafana URL
HORREUM_GRAFANA_URL=https://grafana.example.com:3443
# Internal Grafana URL. This should be secured as ATM Horreum sends the credentials using Basic auth.
HORREUM_GRAFANA_MP_REST_URL=https://grafana.local:3443

# --- HTTP ---
# You might also want to set the IP the webserver is listening to
QUARKUS_HTTP_HOST=123.45.67.89
QUARKUS_HTTP_PORT=443
# Any production instance should be run over secured connections
QUARKUS_HTTP_SSL_CERTIFICATE_KEY_STORE_FILE=/path/to/keystore.jks
QUARKUS_HTTP_SSL_CERTIFICATE_KEY_STORE_PASSWORD=keystore-password
QUARKUS_HTTP_INSECURE_REQUESTS=disabled
# If you share the certificate for Horreum and Keycloak/Grafana disable HTTP/2 to avoid connection coalescing
QUARKUS_HTTP_HTTP2=false
# URL for Horreum external access (advertised in permanent links etc.)
HORREUM_URL=https://horreum.example.com
# Internal URL for services that load data from Horreum (e.g. Grafana)
HORREUM_INTERNAL_URL=https://horreum.local:8443

# --- Mailserver ---
QUARKUS_MAILER_FROM=horreum@horreum.example.com
QUARKUS_MAILER_HOST=smtp.example.com
QUARKUS_MAILER_PORT=25
QUARKUS_MAILER_START_TLS=disabled
QUARKUS_MAILER_LOGIN=disabled

# --- Other ---
# By default webhook notifications that fail to verify TLS integrity fail; set this to ignore verification result.
# HORREUM_HOOK_TLS_INSECURE=true
With all this in you can finally start Horreum as any other Java application (note: dependencies in repo/target/lib/ must be present):
java -jar repo/target/repo-1.0.0-SNAPSHOT-runner.jar
7.2 - OpenShift/Kubernetes
Install Horreum on a OpenShift/Kubernetes cluster
Deploying Horreum for production in OpenShift/Kubernetes is easy using Horreum operator; you can install it through the Operator Marketplace/Operator Hub. This operator installs Horreum and the services it depends on - PostgreSQL database and Keycloak SSO.
Installation steps
- From OperatorHub install
horreumin your namespace. - Create a pvc in the namespace where horreum operator was installed (
oc apply -f <your_pvc_filename>.yaml -n <your_horreum_namespace>). The pvc is required by the postgres database and must be in place before the database pod is created by the operator. PVC should have the same name as specified in the CR definition below. See example pvc definition:
apiVersion: v1
kind: PersistentVolumeClaim
metadata:
  name: horreum-postgres
spec:
  accessModes:
    - ReadWriteOnce
  resources:
    requests:
      storage: 5Gi
  volumeMode: Filesystem
- Create horreum CR, so that all pods will be created by the horreum operator (
oc apply -f <your_cr_filename>.yaml -n <your_horreum_namespace>). See an example of thehorreumresource:
apiVersion: hyperfoil.io/v1alpha1
kind: Horreum
metadata:
  name: example-horreum
spec:
  route:
    host: horreum.apps.mycloud.example.com
  keycloak:
    route:
      host: keycloak.apps.mycloud.example.com
  grafana:
    route:
      host: grafana.apps.mycloud.example.com
  postgres:
    persistentVolumeClaim: horreum-postgres
  report:
    route:
      host: hyperfoil-report.apps.mycloud.example.com
    persistentVolumeClaim: hyperfoil-report
For detailed description of all properties refer to the CRD.
When using persistent volumes make sure that the access rights are set correctly and the pods have write access; in particular the PostgreSQL database requires that the mapped directory is owned by user with id 999.
If you’re planning to use secured routes (edge termination) it is recommended to set the tls: my-tls-secret at the first deploy; otherwise it is necessary to update URLs for clients horreum and horreum-ui in Keycloak manually. Also the Horreum pod needs to be restarted after Keycloak route update.
Currently you must set both Horreum and Keycloak route host explicitly, otherwise you could not log in (TODO).
When the horreum resource gets ready, login into Keycloak using administrator credentials (these are automatically created if you don’t specify existing secret) and create a new user in the horreum realm, a new team role (with -team suffix) and assign it to the user along with other appropriate predefined roles. Administrator credentials can be found using this:
NAME=$(oc get horreum -o jsonpath='{$.items[0].metadata.name}')
oc get secret $NAME-keycloak-admin -o json | \
    jq '{ user: .data.username | @base64d, password: .data.password | @base64d }'
For details of roles in Horreum please refer to user management.
Hyperfoil integration
For your convenience this operator creates also a config map (*-hyperfoil-upload) that can be used in Hyperfoil resource to upload Hyperfoil results to this instance - you can use it directly or merge that into another config map you use for post-hooks. However, it is necessary to define & mount a secret with these keys:
# Credentials of the user you've created in Keycloak
HORREUM_USER=user
HORREUM_PASSWORD=password
# Role for the team the user belongs to (something you've created)
HORREUM_GROUP=engineers-team

oc create secret generic hyperfoil-horreum \
    --from-literal=HORREUM_USER=$HORREUM_USER \
    --from-literal=HORREUM_PASSWORD=$HORREUM_PASSWORD \
    --from-literal=HORREUM_GROUP=$HORREUM_GROUP \
Then set it up in the hyperfoil resource:
apiVersion: hyperfoil.io/v1alpha1
kind: Hyperfoil
metadata:
  name: example-hyperfoil
  namespace: hyperfoil
spec:
  # ...
  postHooks: example-horreum-hyperfoil-upload
  secretEnvVars:
    - hyperfoil-horreum
This operator automatically inserts a webhook to convert test results into Hyperfoil report; In order to link from test to report you have to add a schema (matching the URI used in your Hyperfoil version, usually something like http://hyperfoil.io/run-schema/0.8 and add it an extractor info with JSON path .info. Subsequently go to the test and add a view component with header ‘Report’, accessor you’ve created in the previous step and this rendering script (replacing the hostname):
(value, all) => {
  let info = JSON.parse(value);
  return (
    '<a href="http://example-horreum-report-hyperfoil.apps.mycloud.example.com/' +
    all.id +
    "-" +
    info.id +
    "-" +
    info.benchmark +
    '.html" target=_blank>Show</a>'
  );
};
8 - Reference
Low level reference docs for Horreum
8.1 - Horreum Clients
Reference guide for Horreum clients
Starting from version 0.13, Horreum comes with some autogenerated clients out of the box that can be used to interact with
the Horreum server programmatically.
Right now there are two clients, one for Python and the other one for Go.
Both clients are autogenerated using Kiota openapi generator, and at the moment of writing the autogenerated client is directly exposed
through the HorreumClient instance. Therefore, the interaction with the raw client follows the Kiota experience, more details can be found in the Kiota documentation.
Prerequisites
In the below sections you can find some usage examples for both clients, here the prerequisites to properly running below examples:
- You must have Horreum server up and running (and accessible). You can find more details on how to setup Horreum server in the Get Started section.
- Generate an API key following these instructions. Then replace
HUSR_00000000_0000_0000_0000_000000000000with your generated key.
Python Client
Install the latest Horreum client
pip install horreum
Import required Python libraries
import asyncio
asynciois required because the client leverages it to perform async requests to the server.
from horreum import new_horreum_client, ClientConfiguration, AuthMethod, HorreumCredentials
new_horreum_clientutility function to setup theHorreumClientinstance
Initialize the Horreum client
client = await new_horreum_client(
	base_url="http://localhost:8080",
	credentials=HorreumCredentials(
		apikey="HUSR_00000000_0000_0000_0000_000000000000"
	),
	client_config=ClientConfiguration(
		auth_method=AuthMethod.API_KEY
	)
)
Now let’s start playing with it
# sync call
print("Client version:", client.version())

# async call
print("Server version:", (await client.raw_client.api.config.version.get()).version)
As you might have noticed, the Kiota api follows the REST url pattern. The previous async call was the equivalent of doing
curl -X 'GET' 'http://localhost:8080/api/config/version'. The URL pattern api/config/version is replaced by dot notation
api.config.version.<HTTP_METHOD>.
Golang Client
Install the latest Horreum client
go get github.com/hyperfoil/horreum-client-golang
Import required Go libraries
import (
	"github.com/hyperfoil/horreum-client-golang/pkg/horreum"
)
Define username and password
var (
	apiKey = "HUSR_00000000_0000_0000_0000_000000000000"
)
Initialize the Horreum client
client, err := horreum.NewHorreumClient("http://localhost:8080",
	&horreum.HorreumCredentials{
		ApiKey: &apiKey,
	}, &horreum.ClientConfiguration{
		AuthMethod: horreum.API_KEY,
	})

if err != nil {
    log.Fatalf("error creating Horreum client: %s", err.Error())
}
Now let’s start playing with it
// sync call
fmt.Printf("Server version: %s\n", *v.GetVersion())

// async call
v, err := client.RawClient.Api().Config().Version().Get(context.Background(), nil)
if err != nil {
    log.Fatalf("error getting server version: %s", err.Error())
    os.Exit(1)
}
Similarly to the Python example, the previous async call was the equivalent of doing
curl -X 'GET' 'http://localhost:8080/api/config/version'. The URL pattern api/config/version is replaced by method chain invocation
api().config().version().<HTTP_METHOD>. Here you need to provide your own context to the actual HTTP method call.
8.2 - Webhook Reference
Reference guide for Webhook payload
8.3 - API Filter Queries
Reference guide for API Filter Query
Some APIs provide the ability to filter results when HTTP API response content type is application-json. The API Filter Query operates on the server side to reduce payload size.
API operations that support Filter Query provide an HTTP request parameter named query. The value of the query parameter is a JSONPath expression. Any syntax errors in the JSONPath will cause the operation to fail with details of the syntax issue.
To use the Filter Query with an operation that returns a Run data can be done as follows.
curl -s  'http://localhost:8080/api/sql/1/queryrun?query=$.*&array=true'  -H 'content-type: application/json' -H "X-Horreum-API-Key: $API_KEY"
{
  "valid": true,
  "jsonpath": "$.*",
  "errorCode": 0,
  "sqlState": null,
  "reason": null,
  "sql": null,
  "value": "[\"urn:acme:benchmark:0.1\", [{\"test\": \"Foo\", \"duration\": 10, \"requests\": 123}, {\"test\": \"Bar\", \"duration\": 20, \"requests\": 456}], \"defec8eddeadbeafcafebabeb16b00b5\", \"This gets lost by the transformer\"]}"
}
The response contains an enclosing JSON object that is common for Filter Query operations. The value property contains an array. The elements of the array contain the values of properties in the uploaded Run JSON. Note the additional HTTP request query parameter named array. Setting array is necessary to return dynamically sized results.
To filter the above API operation to retrieve only the results property of the uploaded Run object the query parameter is defined as $.results
curl -s  'http://localhost:8080/api/sql/1/queryrun?query=$.results&array=true'  -H 'content-type: application/json' -H "X-Horreum-API-Key: $API_KEY"
{
  "valid": true,
  "jsonpath": "$.results",
  "errorCode": 0,
  "sqlState": null,
  "reason": null,
  "sql": null,
  "value": "[[{\"test\": \"Foo\", \"duration\": 10, \"requests\": 123}, {\"test\": \"Bar\", \"duration\": 20, \"requests\": 456}]]"
}
The response JSON object this time contains the results property value JSON.
8.4 - Troubleshooting Functions
Steps to troubleshoot use of Functions in Horreum
Troubleshooting Functions and Combination Function
Creating Scheam Labels is one of the key capabilities that enables working with loosely defined data. Using a JSON Validation Schema provides useful guarentees data in an uploaded Run JSON conforms to expected data types. A Validation Schema is optional but when not used makes the handling of metrics unreliable as data types may change.
To troubleshoot use of JavaScript Function the following techniques can be used
- The
typeoffunction to discover the data-type of theExtractorvariable, Object property or Array element in theLabelCombination Function, using the Test label calculation button to reveal the JavaScript data-type
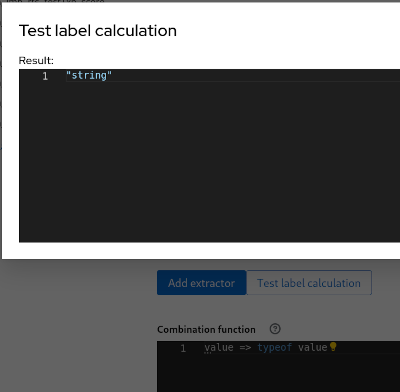
Test label calculation
- View the
Labels calculation Logwindow and display INFO or DEBUG log level, this reveals syntax errors when the function is executed
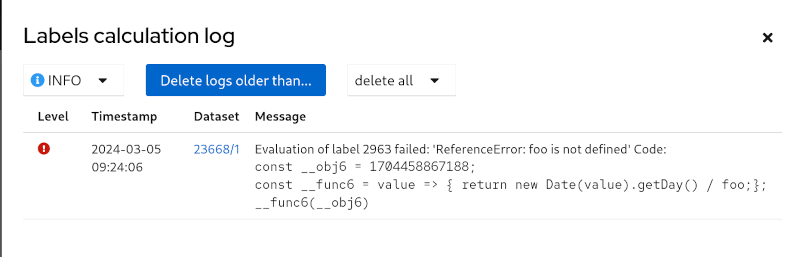
Logged in user, Labels Calculation Log
- Use the Show label values button, provides a quick visual check of resulting values for the
RunDataset
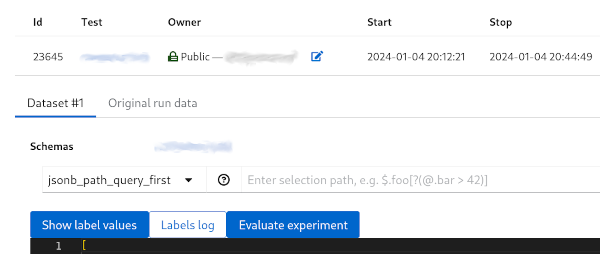
Run Dataset view
Effective label values window reveals the anticipated value or error text which can be due to the following:
- Nan - Numerical expression involves a data-type that is incompatible
- (undefined) - Incorrect JSONPath field value used in the
LabelExtractor - empty - Absence of any value in the uploaded
Run
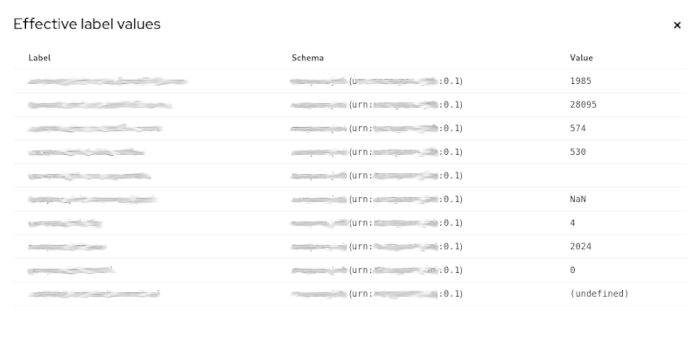
Effective label values