This is the multi-page printable view of this section. Click here to print.
Change Detection
1 - Relative Difference of Means
Overview
The Relative Difference of Means Change Detection algorithm is an algorithm that compares the mean of the last M results to the mean of the previous N results.
If the difference between a summary calculation of two is greater than a threshold, then a change is alerted.
Configuration
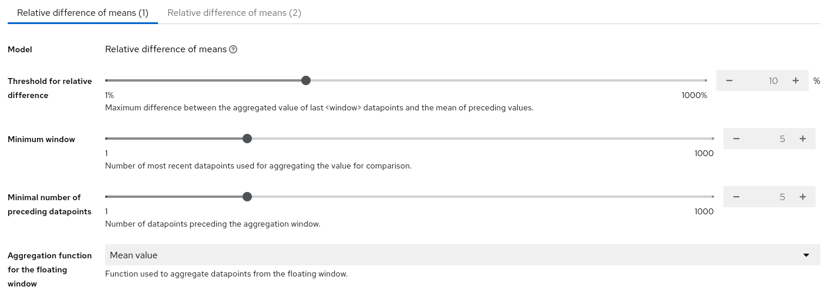
The algorithm is configured with the following parameters:

Configuration
- Threshold - The threshold of percentage difference to use to determine if a change has occurred.
- Minimum Window - The number of results to use in the mean calculation for current time window.
- Minimum Number of Preeceding datapoints - The number of preceding windows to use in the mean calculation for preceeding time window.
- Aggregation Function - The aggregation function to use when calculating the mean. The options are:
- Mean - The average of the results in the window.
- Min - The minimum of the results in the window.
- Max - The maximum of the results in the window.
Example

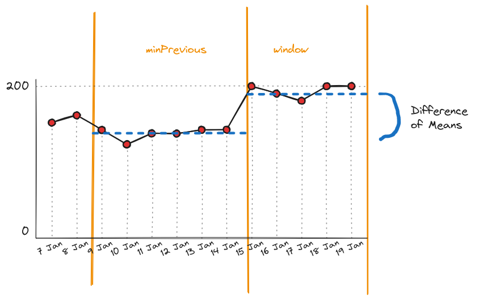
Window Configuration
NOTE: If
Minimum Number of Preeceding datapoints<Minimum Windowthen for the calculationMinimum Number of Preeceding datapointsis set equalMinimum Window
Once a change has been detected, the algorithm will wait until there is sufficient data to fill both windows so that neither contain a change before alerting again. This is to prevent alerting on every result.
Insufficient Data
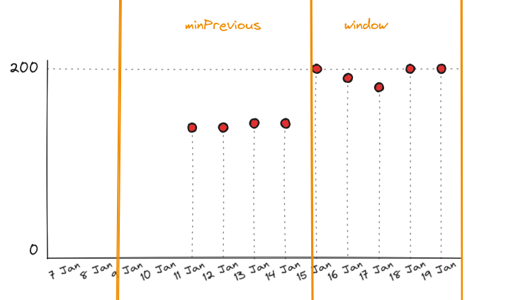
If there are and insufficient number of results to calculate the mean, then the change detection algorithm will not alert. The following image shows an example of insufficient data.
In this case the change detection will wait until there are sufficient results to calculate the mean of the 2 windows.

Insufficient Data
2 - Fixed Threshold
Overview
The Fixed Threshold Change Detection algorithm is a simple algorithm that compares the value of the last datapoint against a predefined threshold.
If the value is greater or less than the threshold, then a change is alerted.
Configuration
The algorithm is configured with the following parameters:

Configuration
- Minimum - The lower bound threshold to determine if a change has occurred.
- Value - Lower bound for acceptable datapoint values.
- Disabled - Whether the lower bound is enabled
- Inclusive - Is the lower bound value included in the evaluation, or are value less than the lower bound considered a change.
- Maximum - The upper bound threshold to determine if a change has occurred.
- Value - Upper bound for acceptable datapoint values.
- Disabled - Whether the Upper bound is enabled
- Inclusive - Is the upper bound value included in the evaluation, or are value more than the upper bound considered a change.
Example

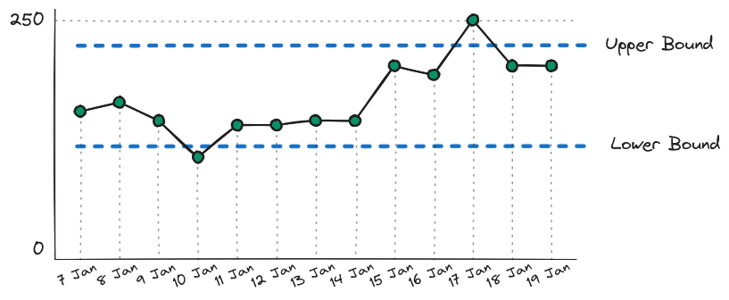
Bounds Chart
The algorithm will evaluate every datapoint against the defined bounds and raise an alert if the datapoint is outside the bounds.
Summary Bounds
Due to the data manipulation and derived metrics capability in Horreum, the bounds can be used to validate ratios, percentages, number standard deviations etc from summary statistics derived from the raw data.
Note: Bound checks do not need to be only used for simple static values.