Grafana
Categories:
Grafana is a popular tool for visualizing time series data. Horreum can be configured as a datasource in Grafana to allow you to view the data processed by Horreum.
Prerequisites:
- Horreum is running, and you are logged in
- You have access to a running Grafana instance. If you do not have an environment available, please follow the official documentation for your platform.
Configure Horruem as a Datasource
1. Install the JSON Datasource plugin for Grafana
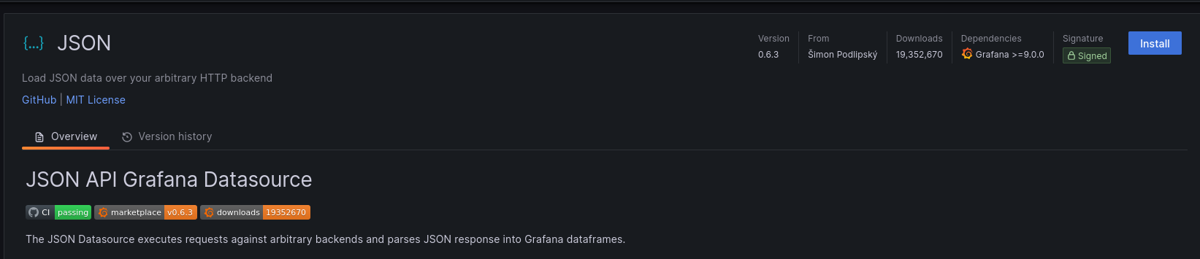
Install JSON Grafana Plugin
2. Add new Datasource
2.1 Click “Add new data source” button
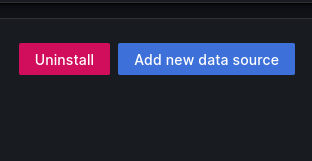
Click “Add new data source”
2.2 Configure Horreum as a Datasource
Configure the datasource as follows:
- Name: Horreum
- URL: https://<horreum_host>/api/changes
- Access: Server (Default)
- Forward OAuth Identity: checked
Click “Save & Test” button
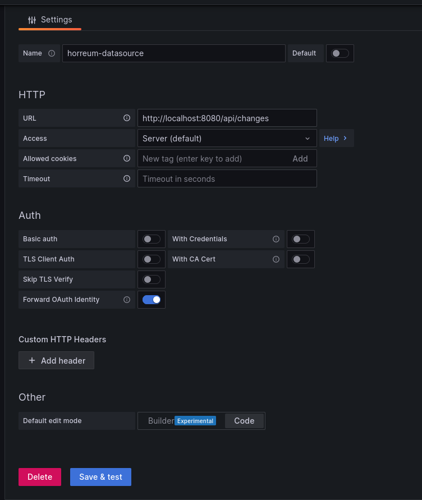
Configure Horreum JSON Datasource
If successful, you should see the following message:
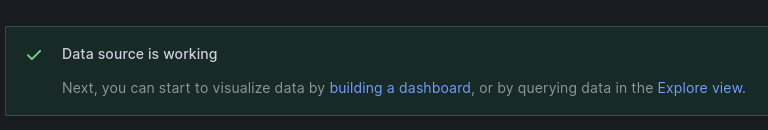
Datasource Successful
Querying Horreum data
Now that you have Horreum configured as a datasource, you can query the data in Horreum from Grafana.
1.1 Create a new Dashboard
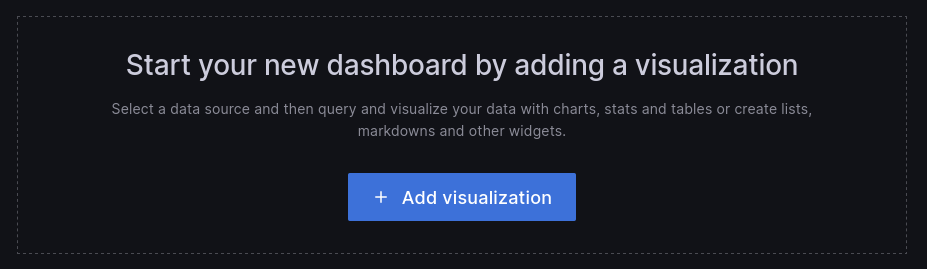
Create new Dashboard
2.2 Add Horreum as Datasource
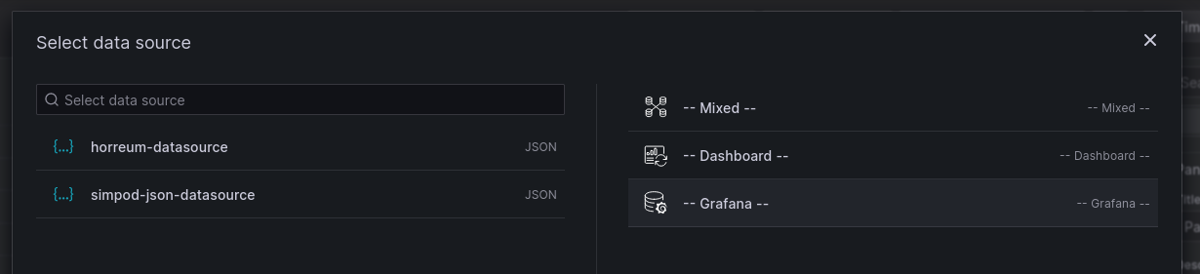
Select Horreum Datasource created in previous step
2.3 Provide a name for the new Panel
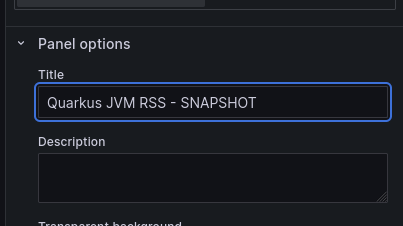
Set panel name
2.4 Define query
Horreum provides an API that Grafana can natively query.
In order for Grafana to query Horreum, you must provide a Metric payload that defines the query.
The Metric is a String that consists of the Variable ID and Fingerprint seperated by a semi-colon ;.
e.g. Metric : 23219;{"buildType":"SNAPSHOT"}
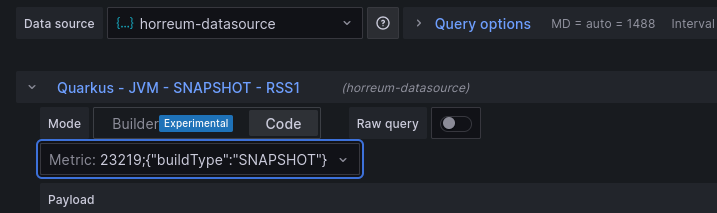
Define query metric
2.5 Save panel
Save panel
2.5 View Dashboard
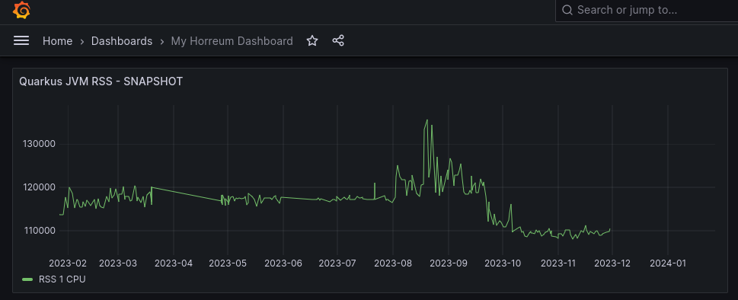
View Dashboard
Feedback
Was this page helpful?
Glad to hear it! Please tell us how we can improve.
Sorry to hear that. Please tell us how we can improve.