Define a Schema
Prerequisites: You have already
- uploaded some data
In order to extract data from the Run JSON document we need to annotate it with $schema and tell Horreum how to query it.
Make sure that you’re logged in, on the upper bar go to Schemas and click ‘New Schema’ button:

User logged in
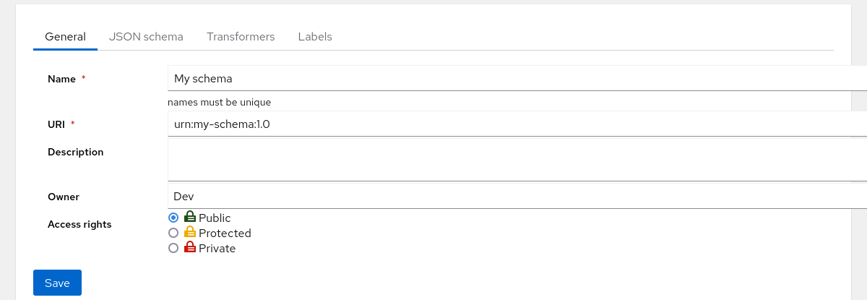
Fill in the name and URI (urn:my-schema:1.0 if you’re using the uploaded example) and hit the Save button on the bottom.

User logged in
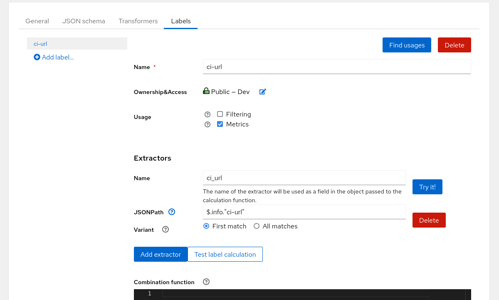
Switch tab to ‘Labels’ and add two labels: let’s call first ci-url where you’d extract just single item from the JSON document using PostgreSQL JSON Path $.info."ci-url". In that case you can ignore the combination function as you don’t need to combine/calculate anything. You can uncheck the ‘filtering’ checkbox as you likely won’t search your datasets based on URL.

User logged in
Combination Functions
In the situation a derived metric is necessary the Combination Function is used to calculate the value.
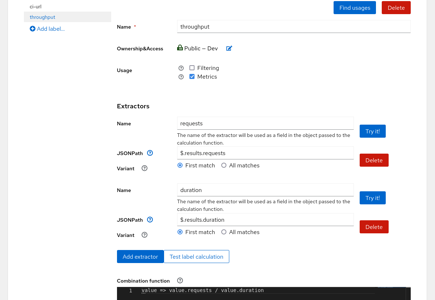
Here we create a seperate Label called throughput and we extract two elements from the JSON document: requests using $.results.requests and duration using $.results.duration. In this case the input to the calculation function will be an object with two fields: requests and duration. You can get throughput by adding combination function (in JavaScript) in the lambda syntax value => value.requests / value.duration. Had we used only one JSON Path the only argument to the function would be directly the result of the JSON Path query.
Note that this function is calculated server-side and it is cached in the database. It is automatically recalculated when the label definition changes; the datasets are processed asynchronously, though, so there might be some lag.

User logged in
Finally hit the Save button, go to Tests and in the table click on the 1 with folder icon in Datasets column. (Note that by default a Run produces single dataset - more about this in Transform Runs into Datasets. This will bring you to the listing of datasets in this test, and this time you can see in Schema tab that the schema was recognized.

User logged in
However you still don’t see the labels - for that click on the ‘Edit test’ button and switch to ‘Views’ tab. The ‘Default’ View is already created but it’s empty; hit the ‘Add component’ button on the right side twice and fill in the columns, using the labels we’ve created before. We can further customize the ‘Throughput’ by adding the “reqs/s” suffix. Note that this function can return any HTML, this will be included into the page as-is. The rendering happens client-side and you have the dataset entity (not just the JSON document) as the second argument to the render function. Third argument would be your personal OAuth token.
It’s not necessary to turn URLs into hyperlinks, though; Horreum will do that for you.

User logged in
To see the result click on the Save button and then on ‘Dataset list’ in the upper part. Now you’ll see the CI link and throughput columns in place. If the labels are not calculated correctly you can enter the Dataset by clicking on its ID in the Run column and explore Label values through the button above the JSON document. If there was e.g. a syntax error in the Javascript function you could find an error in the ‘Labels log’ there, too.

User logged in
You might be wondering why you can’t set the JSON path directly in the view; Concepts explains why this separation is useful when the format of your data evolves. Also, label defined once can be used on multiple places, e.g. for Change Detection.
Feedback
Was this page helpful?
Glad to hear it! Please tell us how we can improve.
Sorry to hear that. Please tell us how we can improve.