This is the multi-page printable view of this section. Click here to print.
Tutorials
1 - Get Started
Running Horreum locally
In this tutorial we’ll show you how to start Horreum and its infrastructure using container technologies such as podman or docker.
1: install required software
Make sure that you have either podman and podman-compose or docker and docker-compose installed. Some scripting we have prepared to simplify the startup also requires curl and jq. On Fedora you would run
sudo dnf install -y curl jq podman podman-plugins podman-compose
This setup is going to use ports 8080 (Horreum application), 8180 (Keycloak), and 5432 (PostgreSQL) on localhost. Please make sure that these are not used by any other application.
2: start Horreum
We have prepared a simple script that downloads all the necessary files and starts all containers in host-network mode:
curl -s https://raw.githubusercontent.com/Hyperfoil/Horreum/0.6/infra/start.sh | bash
After a few moments everything should be up and ready, and a browser pointed to http://localhost:8080 will open.
3: log in
In the upper right corner you should see the Log in button. Press that and fill in username user and password secret. When you sign in the upper right corner you should see that you’re authenticated as ‘Dummy User’.
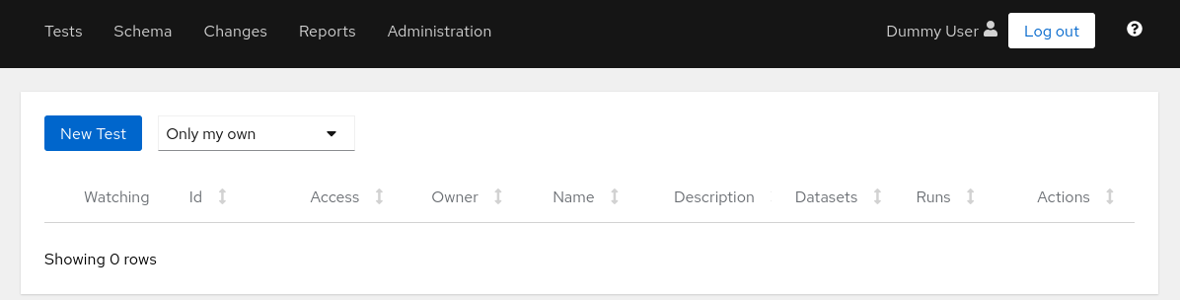
User logged in
You can explore the application but at this moment it is empty. Let’s continue with creating a test and uploading a run.
stop Horreum
You can stop and remove all the containers using the command below:
podman kill $(podman ps -q --filter 'label=io.podman.compose.project=horreum')
podman rm $(podman ps -q -a --filter 'label=io.podman.compose.project=horreum')
2 - Upload your first Run
Create a Test and upload a Run
This tutorial will present the most basic thing Horreum can do: store your benchmark results in the form of JSON files.
We assume that you already went through the previous tutorial, Horreum is up and you are logged in.

User logged in
1. Create Test
Press the New Test button and fill the test name. Test names must be unique within Horreum.
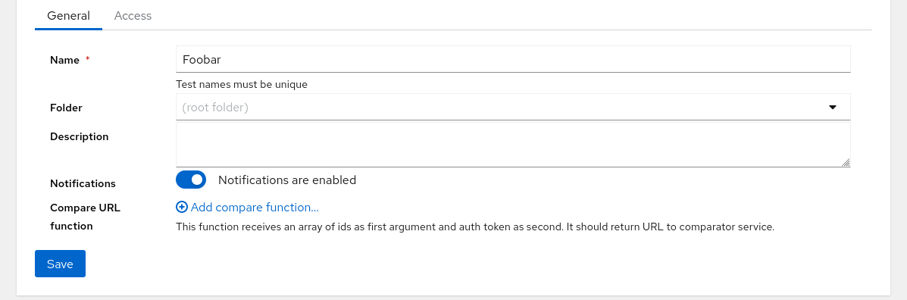
Create new test
Click on Save button on left side at the bottom - a blue banner will confirm that the test was created.
2. Prepare test data
Now we can prepare the JSON document representing our benchmark results - open /tmp/run.json with your favorite text editor and paste in this:
{
  "$schema": "urn:my-schema:1.0",
  "throughput": 1234.5
}
3. Generate API Key
To interact with the REST API, you will need an API Key, please follow the instructions to generate an API Key
4. Upload Data
Now copy and paste this into shell; the reply will be just 1 - the ID of the newly uploaded run.
API_KEY='HUSR_00000000_0000_0000_0000_000000000000'
TEST='Foobar'
START='2021-08-01T10:35:22.00Z'
STOP='2021-08-01T10:40:28.00Z'
OWNER='dev-team'
ACCESS='PUBLIC'
curl 'http://localhost:8080/api/run/data?test='$TEST'&start='$START'&stop='$STOP'&owner='$OWNER'&access='$ACCESS \
    -s -H 'content-type: application/json' -H "X-Horreum-API-Key: $API_KEY" \
    -d @/tmp/run.json
5. View Data in Horreum
Let’s navigate into the tests overview (main page) by clicking the Tests link in the main menu on the top left of the page:
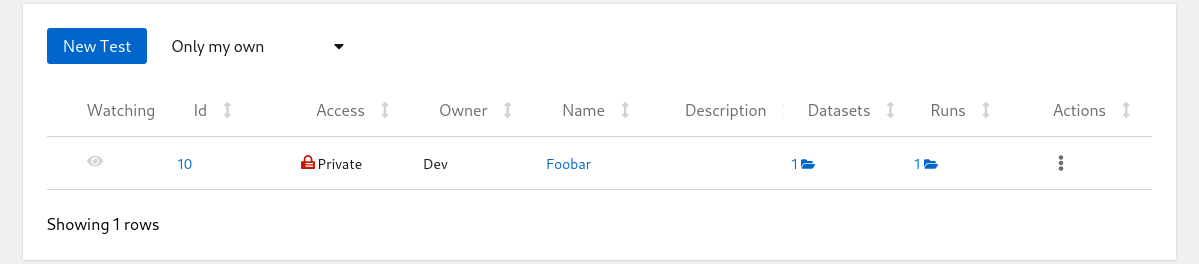
List of Tests
Click on the run count number with open-folder icon to see the listing of all runs for given test:
List of Runs
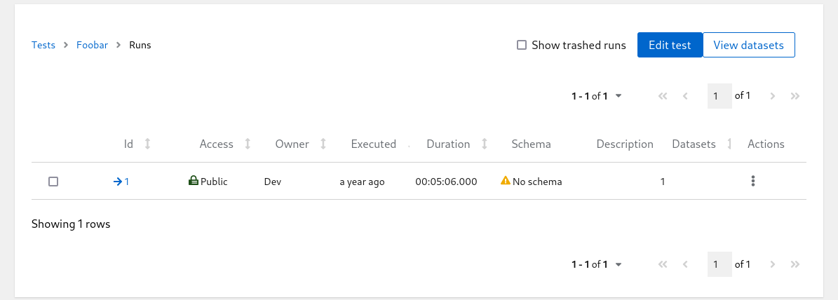
At this point don’t worry about the ‘No schema’ warning. Hit the run ID with arrow icon in one of the first columns and see the contents of the run you just created:
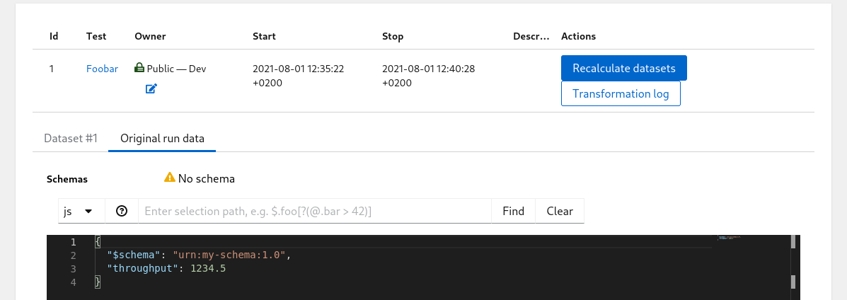
List of Runs
3 - Query Collector API
Prerequisites:
- Horreum is running, and you are logged in
- You have access to a running Collector instance that already contains JSON data
- You have previously defined a
Schemafor the JSON data you wish to analyze, please see Define a Schema
Create a Test and query data from a Collector instance
This tutorial will guide you through how to connect to a remote Collector instance, and perform change detection on existing data in an index.
Configure Collector Datastore
Please follow the Collector Integration guide to configure a new Collector Datastore.
Query Data from Collector
The procedure is the same as described in the Upload your first Run tutorial
To query data from a Collector instance, you need to know the tag and imgName of the data you wish to analyze.
You will also need to determine the date range of the data you wish to analyze using newerThan and olderThan.
{
  "tag": "quarkus-main-ci",
  "imgName": "quarkus-integration-test-main-999-SNAPSHOT-runner",
  "newerThan": "2024-09-20 00:00:00.000",
  "olderThan": "2024-09-25 00:00:00.000"
}
where;
- tag: the tag of the data you wish to analyze
- imgName: the image name (aka test) of the data you wish to analyze
- newerThan: the start date of the data you wish to analyze
- olderThan: the end date of the data you wish to analyze
The query can be executed by making a call to the Horreum API;
$ curl 'http://localhost:8080/api/run/data?test='$TEST'&start='$START'&stop='$STOP'&owner='$OWNER'&access='$ACCESS \
    -s -H 'content-type: application/json'  -H "X-Horreum-API-Key: $API_KEY" \
    -d @/tmp/collector_query.json
The query will return a list of RunID’s for each json object retrieved and analyzed from Collector.
What Next?
After successfully querying data from Collector, you can now:
- optionally Transform Runs to Datasets to transform the data into datasets
- Configure Change Detection to detect regressions in the data.
- Configure Actions to trigger events when regressions are detected.
4 - Use data in Grafana
Prerequisites:
- Horreum is running, and you have an access token
- Grafana is running, and you can update dashboards
Grafana setup
This tutorial uses the JSON API plugin to retrieve data from Horreum. The JSON API Plugin can be installed from the grafana administrator panel.
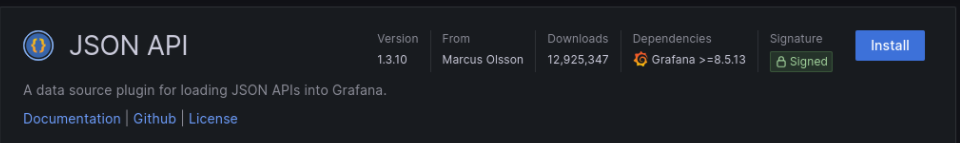
Install JSON API Grafana Plugin
Next we need to create a datasource that will connect to the Horreum URL.
For the example we are connecting to a local development instance of horreum running on localhost using port 8080.
The datasource url does not have to include the /api but including it in the datasource saves us from having to include /api
each time we fetch data from the datasource.
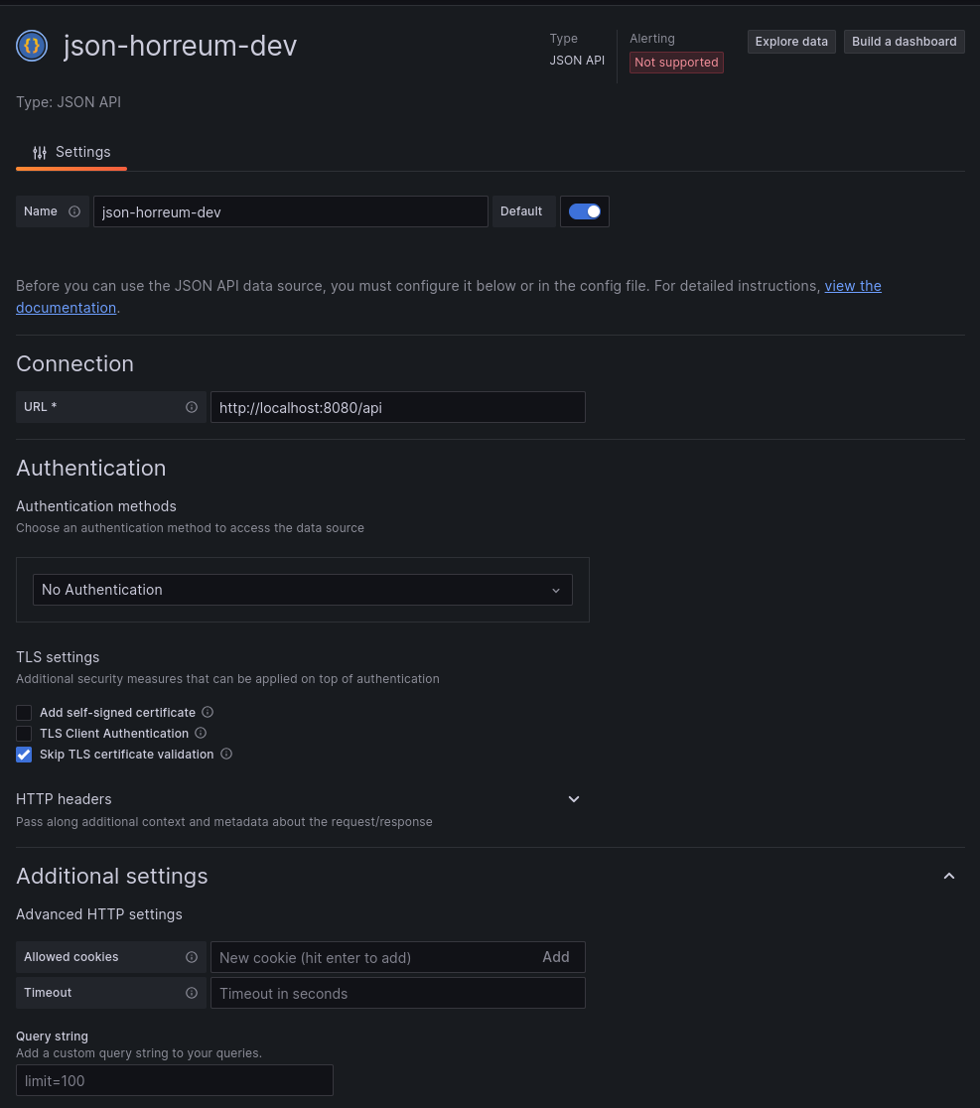
Create JSON API datasource
That’s it, Grafana is ready to start consuming data from Horreum. The next steps depend on what we want to display in Grafana.
Key Metrics in Grafana
Horreum accepts any json format for a run and uses Labels (TODO link) to extract or calculate key metrics.
Metric values, referred to as Label Values in horreum, are automatically calculated for each upload. There is an API
to retrieve the values for a specific upload but that would be tedious for comparing across runs.
The test api endpoint has a /labelValues (TODO link to documentation) that can retrieve a filtered list of all the label values from each upload.
/test/${testId}/labelValues
The response is a list of json objects that contain the labelValue for each upload. There is actually a json object per dataset but not all runs are parsed into multiple datasets so the distinction is not necessary for most use cases.
[
    {  runId: 101, datasetid: 100, values: {metricName: metricValue,...},
    ...
]
The key data is in the values field of each entry.
Add a panel to a dashboard in grafana then select the new JSON API datasource as the datasource for the panel.
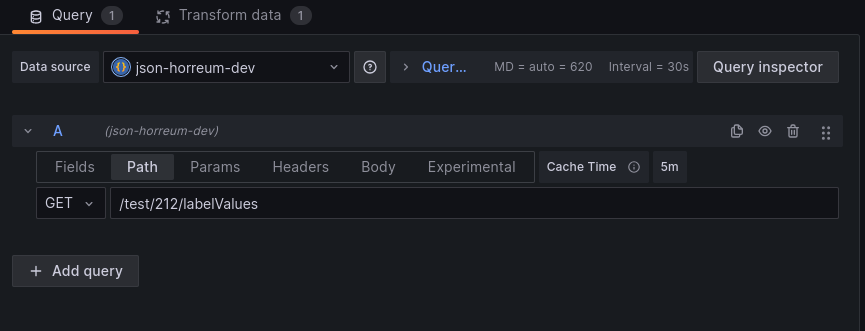
Set panel datasource
Grafana can now access the data but we need to define fields to tell the panel how to extract information from the json.
There are 3 fields for the /labelValues endpoint:
values - the content of the labels
runId - the unique ID assigned to the run that was uploaded to horreum
datasetId - the unique ID that was assigned to the dataset extracted from the run
The example below defines fields in Grafana for all three but the values field is where the metrics are located.
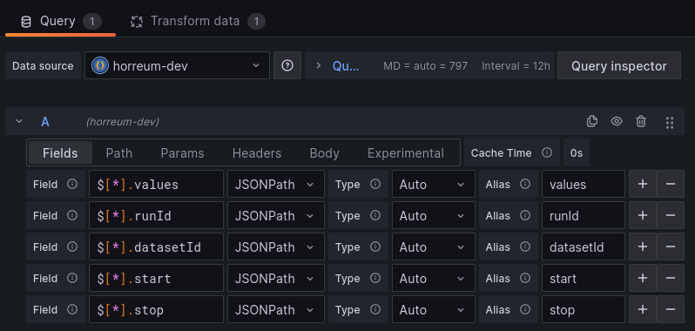
Define fields for the json
The next step is to define a Grafana transform to turn the values into the dataframe structure Grafana expects.
Use the extract fields transform on the values field from the previous step.
Define fields for the json
Grafana should now recognize all the labels as different datapoints. At this point, customizing the grafana panel depends on what values are found in each label and what kind of panel you want to create.
Filtering results
There is a good chance you only want data from certain runs.
The /labelValues endpoint supports a filter query parameter to filter out datasets.
There are 2 ways to filter:
provide a json object that must exist in the label values.
For example, if
versionandtxRateare label names then{"version":"1.2.3"}will only include labelValues whereversion=1.2.3and{"version":"1.2.3","txRate":2000}will add thetxRate=2000requirement.
curl –query-param “filter={"version":"1.2.3","txRate":2000}”
:/api/test/{id}/labelValues
Grafana offers a multi-select option for variables. This sends the options as an array when using json encoding.
Horreum will default to looking for a label with an array value instead of any value in the array.
Adding the multiFilter=true query parameter allows Horreum to also look for any value in the array and supports Grafana mulit-select.
curl –query-param “multiFilter=true” –query-param “filter={"count":[1,2,4,8]}”
:/api/test/{id}/labelValues
provide a json path (an extractor path from labels) that needs to evaluate to true
For example, if
countis a label we can pass in$.count ? (@ > 10 && @ < 20)to only include datasets where count is between 10 and 20.
curl –query-param “filter="$.count ? (@ > 10 && @ < 20)"”
:/api/test/{id}/labelValues
We set the filter parameter by editing the Query for the grafana panel.
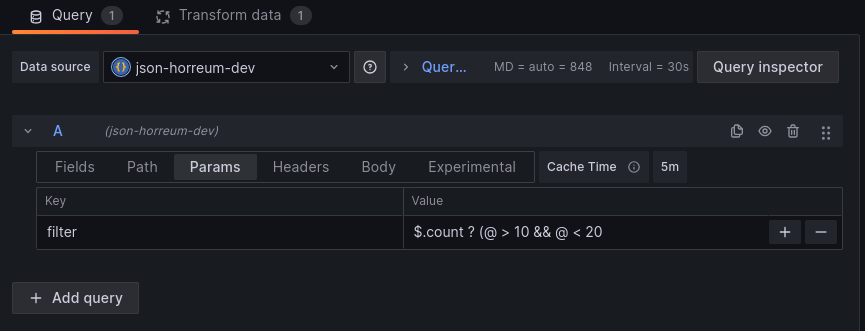
Define filter for query
Filtering labels
Another common consideration is the amount of data in the /labelValues response. Tests with lots of labels, or labels that produce a lot of data,
can see the /labelValues transfer json size grow well beyond what they need for a particular integration. Horreum has the include and exclude
query parameter options on the /labelValues endpoint.
Include
Adding include=foo to the /labelValues endpoint query tells Horreum to only include the foo label and its value in the values part of the
/labelValues response. You can specify multiple labels with incude=foo&include=bar or include=foo,bar using url encoding or with curl:
curl --query-param "include=foo" --query-param "include=bar" ...
Note: any include that is also mentioned in exclude will not be part of the response values
Exclude
This functions similar to include except that it removes a label name from the response values field for the /labelValues endpoint. This filter
option leaves all other labels in the values field.
If a user specifies both include and exclude then the response will only contain the include label names that are not also in exclude. If all
include are also in exclude then the exclude takes priority and the response will contain all labels that are not mentioned in exclude.
Horreum uses this default behavior to avoid sending any data that is explicitly excluded.
5 - Query Elasticsearch
Prerequisites:
- Horreum is running, and you are logged in
- You have access to a running Elasticsearch instance that already contains JSON data
- You have previously defined a
Schemafor the JSON data you wish to analyze, please see Define a Schema
Create a Test and query data from an Elasticsearch instance
This tutorial will guide you through how to connect to a remote Elasticsearch instance, and perform change detection on existing data in an index.
Configure Elasticsearch Datastore
Please follow the Elasticsearch Integration guide to configure a new Elasticsearch Datastore.
Query Data from Elasticsearch
There are two methods for querying existing data from an Elasticsearch instance, either a single document, or multiple documents from a query.
The procedure is the same as described in the Upload your first Run tutorial
Query single document from Elasticsearch datastore
To analyze a single document from Elasticsearch, you need to know the index and document id of the document you wish to analyze.
The json payload for a single Elasticsearch document is as follows:
{
  "index": ".ds-kibana_sample_data_logs-2024.01.11-000001",
  "type": "doc",
  "query": "RUO1-IwBIG0DwQQtm-ea"
}
where;
- index: name of the Elasticsearch index storing the document
- type: “DOC” for a single document
- query: the document id of the document to analyze
The document query can then be sumitted to the Horreum API;
$ curl 'http://localhost:8080/api/run/data?test='$TEST'&start='$START'&stop='$STOP'&owner='$OWNER'&access='$ACCESS \
    -s -H 'content-type: application/json' -H "X-Horreum-API-Key: $API_KEY" \
    -d @/tmp/elastic_payload.json
The api will return the RunID for the document retrieved and analyzed from Elasticsearch.
Query Multiple documents from single index in Elasticsearch datastore
It is also possible to query multiple documents from Elasticsearch with a single call to the Horreum API.
{
    "index": ".ds-kibana_sample_data_logs-2023.12.13-000001",
    "type": "search",
    "query": {
        "from" : 0, "size" : 100,
        "query": {
            "bool" : {
            "must" : [
                { "term" : {  "host": "artifacts.elastic.co" } }
            ],
            "filter": {
                "range": {
                    "utc_time": {
                    "gte": "2023-12-01T09:28:48+00:00",
                    "lte": "2023-12-14T09:28:48+00:00"
                    }
                }
            },
            "boost" : 1.0
            }
        }
    }

}
where;
- index: name of the Elasticsearch index storing the documents
- type: “SEARCH” for a query
- query: the Elasticsearch query to execute
NOTE: The
queryfield can be any query that Elasticsearch search API supports, please see The Search API for more information.
The query can be executed by making a call to the Horreum API;
$ curl 'http://localhost:8080/api/run/data?test='$TEST'&start='$START'&stop='$STOP'&owner='$OWNER'&access='$ACCESS \
    -s -H 'content-type: application/json' -H "X-Horreum-API-Key: $API_KEY" \
    -d @/tmp/elastic_query.json
The query will return a list of RunID’s for each document retrieved and analyzed from Elasticsearch.
Query Multiple Index for documents in Elasticsearch datastore
If your ElasticSearch instance contains meta-data and the associated documents in separate indexes, it is possible to query the meta-data index to retrive a list of documents to analyse with Horreum using a “MULTI_INDEX” query
{
    "index": ".ds-elastic_meta-data-index",
    "type": "multi-index",
    "query": {
      "targetIndex": ".ds-elastic_secondary-index",
      "docField": "remoteDocField",
      "metaQuery": {
        "from": 0,
        "size": 100,
        "query": {
          "bool": {
            "must": [
              {
                "term": {
                  "host": "artifacts.elastic.co"
                }
              }
            ],
            "filter": {
              "range": {
                "utc_time": {
                  "gte": "2023-12-01T09:28:48+00:00",
                  "lte": "2023-12-14T09:28:48+00:00"
                }
              }
            },
            "boost": 1.0
          }
        }
      }
    }
}
where;
- index: name of the Elasticsearch index storing the meta-data
- type: “mult-index” for a multi-index query
- query:
- targetIndex: the name of the index containing the documents to analyze
- docField: the field in the meta-data index that contains the document id of the document to analyze
- metaQuery: the Elasticsearch query to execute on the meta-data index
Horreum will query the meta-data index, retrieve all matching documents. The meta-data and document contents can be used in any Horreum analysis.
The query will return a list of RunID’s for each document retrieved and analyzed from Elasticsearch.
What Next?
After successfully querying data from Elasticsearch, you can now:
- optionally Transform Runs to Datasets to transform the data into datasets
- Configure Change Detection to detect regressions in the data.
- Configure Actions to trigger events when regressions are detected.