Use data in Grafana
Categories:
Prerequisites:
- Horreum is running, and you have an access token
- Grafana is running, and you can update dashboards
Grafana setup
This tutorial uses the JSON API plugin to retrieve data from Horreum. The JSON API Plugin can be installed from the grafana administrator panel.

Install JSON API Grafana Plugin
Next we need to create a datasource that will connect to the Horreum URL.
For the example we are connecting to a local development instance of horreum running on localhost using port 8080.
The datasource url does not have to include the /api but including it in the datasource saves us from having to include /api
each time we fetch data from the datasource.
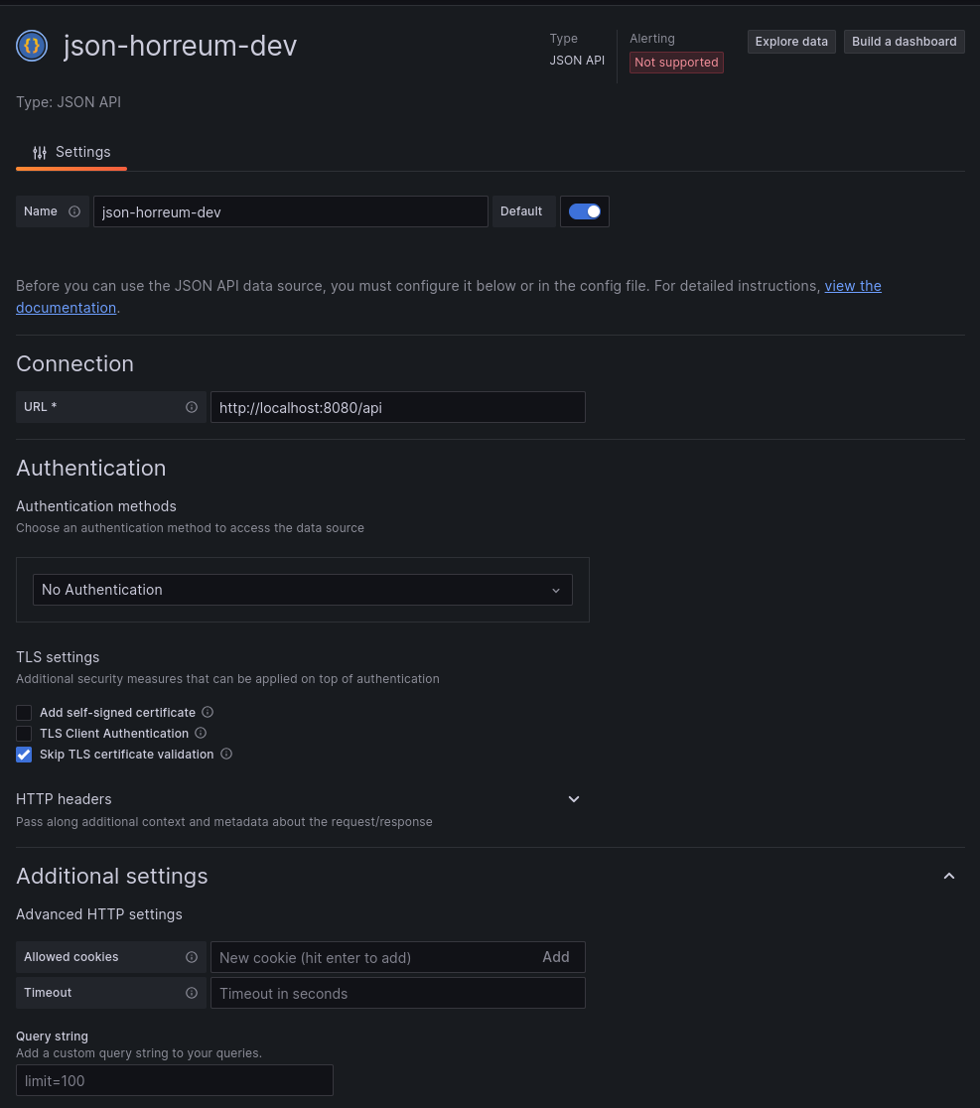
Create JSON API datasource
That’s it, Grafana is ready to start consuming data from Horreum. The next steps depend on what we want to display in Grafana.
Key Metrics in Grafana
Horreum accepts any json format for a run and uses Labels (TODO link) to extract or calculate key metrics.
Metric values, referred to as Label Values in horreum, are automatically calculated for each upload. There is an API
to retrieve the values for a specific upload but that would be tedious for comparing across runs.
The test api endpoint has a /labelValues (TODO link to documentation) that can retrieve a filtered list of all the label values from each upload.
/test/${testId}/labelValues
The response is a list of json objects that contain the labelValue for each upload. There is actually a json object per dataset but not all runs are parsed into multiple datasets so the distinction is not necessary for most use cases.
[
    {  runId: 101, datasetid: 100, values: {metricName: metricValue,...},
    ...
]
The key data is in the values field of each entry.
Add a panel to a dashboard in grafana then select the new JSON API datasource as the datasource for the panel.
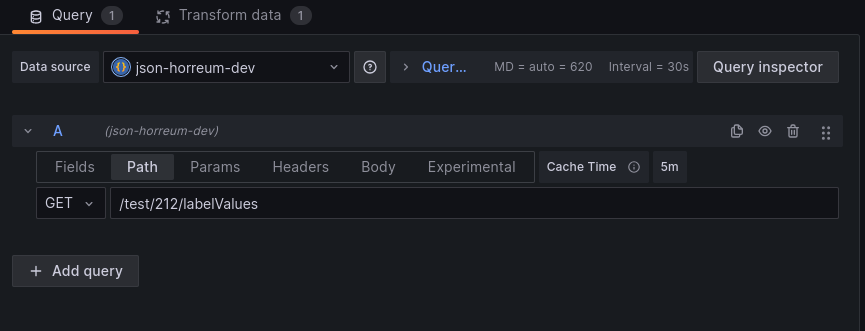
Set panel datasource
Grafana can now access the data but we need to define fields to tell the panel how to extract information from the json.
There are 3 fields for the /labelValues endpoint:
values - the content of the labels
runId - the unique ID assigned to the run that was uploaded to horreum
datasetId - the unique ID that was assigned to the dataset extracted from the run
The example below defines fields in Grafana for all three but the values field is where the metrics are located.
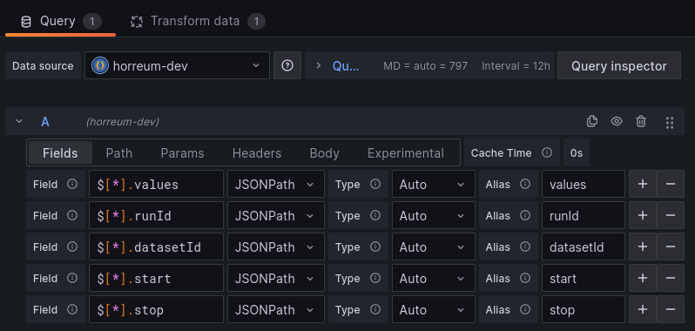
Define fields for the json
The next step is to define a Grafana transform to turn the values into the dataframe structure Grafana expects.
Use the extract fields transform on the values field from the previous step.
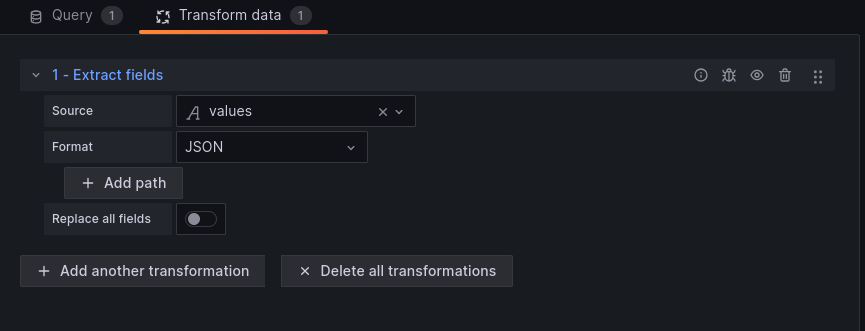
Define fields for the json
Grafana should now recognize all the labels as different datapoints. At this point, customizing the grafana panel depends on what values are found in each label and what kind of panel you want to create.
Filtering results
There is a good chance you only want data from certain runs.
The /labelValues endpoint supports a filter query parameter to filter out datasets.
There are 2 ways to filter:
provide a json object that must exist in the label values.
For example, if
versionandtxRateare label names then{"version":"1.2.3"}will only include labelValues whereversion=1.2.3and{"version":"1.2.3","txRate":2000}will add thetxRate=2000requirement.
curl –query-param “filter={"version":"1.2.3","txRate":2000}”
:/api/test/{id}/labelValues
Grafana offers a multi-select option for variables. This sends the options as an array when using json encoding.
Horreum will default to looking for a label with an array value instead of any value in the array.
Adding the multiFilter=true query parameter allows Horreum to also look for any value in the array and supports Grafana mulit-select.
curl –query-param “multiFilter=true” –query-param “filter={"count":[1,2,4,8]}”
:/api/test/{id}/labelValues
provide a json path (an extractor path from labels) that needs to evaluate to true
For example, if
countis a label we can pass in$.count ? (@ > 10 && @ < 20)to only include datasets where count is between 10 and 20.
curl –query-param “filter="$.count ? (@ > 10 && @ < 20)"”
:/api/test/{id}/labelValues
We set the filter parameter by editing the Query for the grafana panel.
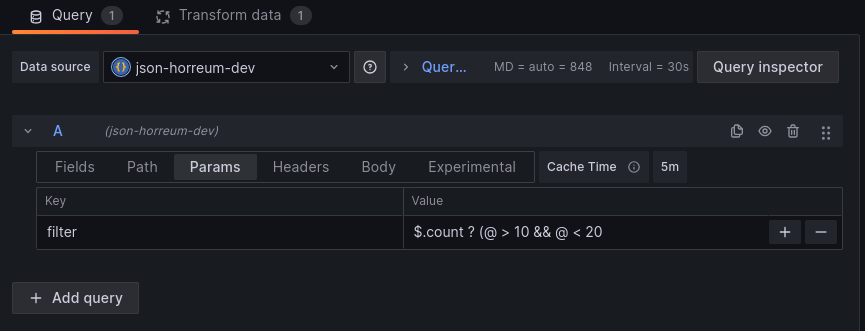
Define filter for query
Filtering labels
Another common consideration is the amount of data in the /labelValues response. Tests with lots of labels, or labels that produce a lot of data,
can see the /labelValues transfer json size grow well beyond what they need for a particular integration. Horreum has the include and exclude
query parameter options on the /labelValues endpoint.
Include
Adding include=foo to the /labelValues endpoint query tells Horreum to only include the foo label and its value in the values part of the
/labelValues response. You can specify multiple labels with incude=foo&include=bar or include=foo,bar using url encoding or with curl:
curl --query-param "include=foo" --query-param "include=bar" ...
Note: any include that is also mentioned in exclude will not be part of the response values
Exclude
This functions similar to include except that it removes a label name from the response values field for the /labelValues endpoint. This filter
option leaves all other labels in the values field.
If a user specifies both include and exclude then the response will only contain the include label names that are not also in exclude. If all
include are also in exclude then the exclude takes priority and the response will contain all labels that are not mentioned in exclude.
Horreum uses this default behavior to avoid sending any data that is explicitly excluded.
Feedback
Was this page helpful?
Glad to hear it! Please tell us how we can improve.
Sorry to hear that. Please tell us how we can improve.